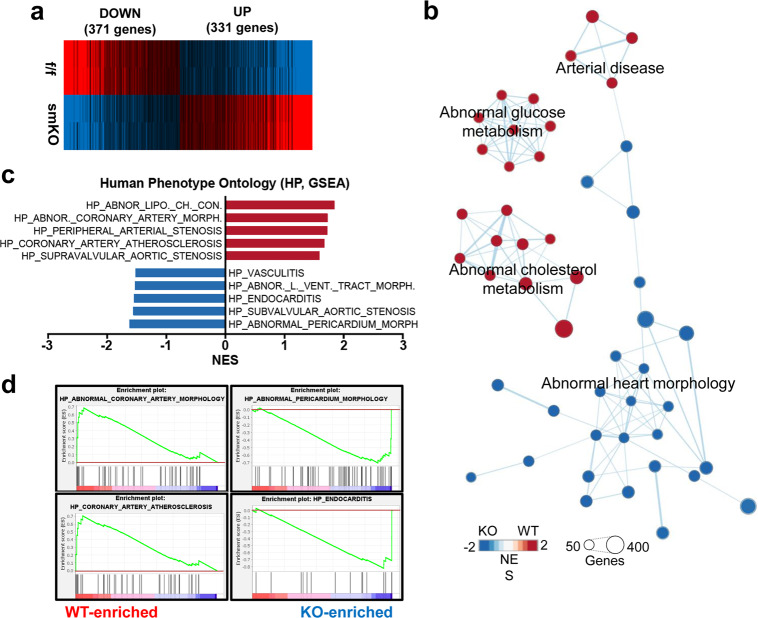
Fig. 6. Gene expression profiles of aortas of the f/f and smKO mice.
a Heatmap of reactome database clusters demonstrating the expression pattern of genes with up- and downregulated expression between the f/f and smKO aortic samples. b The enrichment map highlighting the results of Gene Set Enrichment Analysis (GSEA) of RNA samples from the f/f and smKO aortas (n = 2). c Bar charts presenting the normalized enrichment score (NES) of The Human Phenotype Ontology data (Molecular Signatures Database v7.2, GSEA, Broad Institute). d GSEA enrichment plots showing representative gene sets of The Human Phenotype Ontology database.

