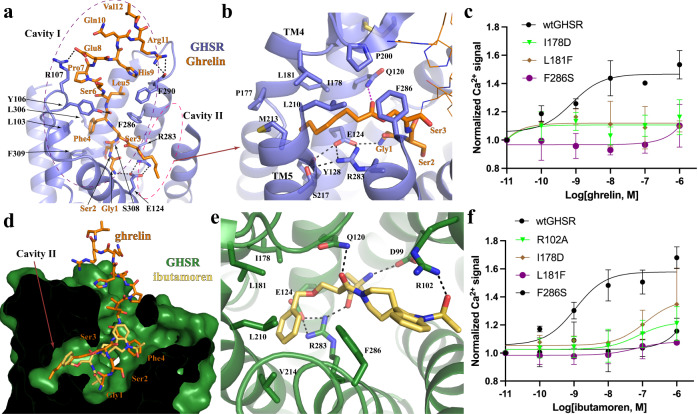
Fig. 2. Binding pockets for ghrelin and ibutamoren.
a Ghrelin binding in the cavity I and II. Ghrelin residues are labeled in orange. GHSR is colored in slate. b Binding of the octanoyl group of ghrelin in the cavity II. c Dose-dependent action of ghrelin on the wild type GHSR (wtGHSR) and mutants. d Alignment of ghrelin and ibutamoren. GHSR bound to ibutamoren is colored green. Ibutamoren is shown as yellow sticks. e Ibutamoren binding pocket. f Dose-dependent action of ibutamoren on wtGHSR and mutants. In c and f, agonist-induced GHSR signaling was measured by Ca2+ mobilization assay. Each data point represents mean ± S.D. from three independent assays. Polar interactions are shown as dashed lines in (a, b, and e).

