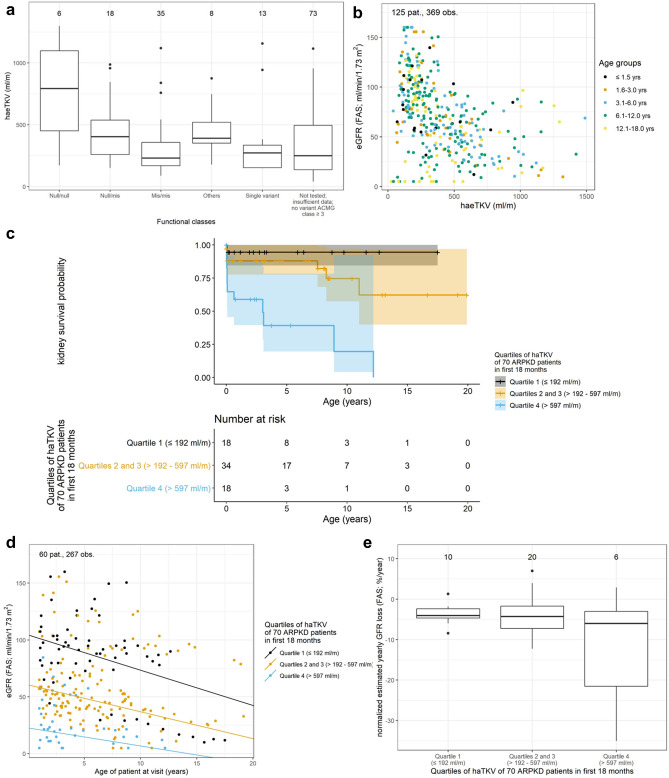
Figure 2.
Correlation of haeTKV to genetics and kidney function: HaeTKV values for different groups of genotypes. The first documented haeTKV value was used for each patient (a). eGFR and haeTKV show a loose inverse relation in the total cohort (b). Kaplan–Meier of kidney survival. The highest quartile of haeTKVmax18values shows poorest kidney outcome (c). Scatter plot and regression lines of eGFR values of haeTKVmax18 patients stratified according to haeTKVmax18 quartiles (d). Normalized yearly eGFR loss of haeTKVmax18 patients stratified according to haeTKVmax18 quartiles. Only patients with at least 3 visits spanning at least one year were used to obtain valid estimations (e).

