
FIGURE 7.
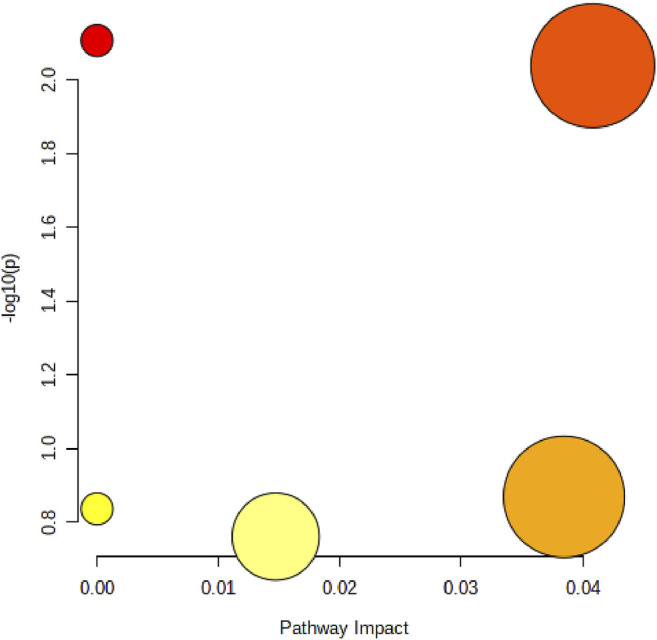
Disordered lipid metabolism pathway caused by alcohol. The size of the circle represents the pathway impact value (X-axis), and the lightness of the color represents the p-value weight (white to red, Y-axis).
Official websites use .gov
A
.gov website belongs to an official
government organization in the United States.
Secure .gov websites use HTTPS
A lock (
) or https:// means you've safely
connected to the .gov website. Share sensitive
information only on official, secure websites.
Disordered lipid metabolism pathway caused by alcohol. The size of the circle represents the pathway impact value (X-axis), and the lightness of the color represents the p-value weight (white to red, Y-axis).