
FIGURE 2.
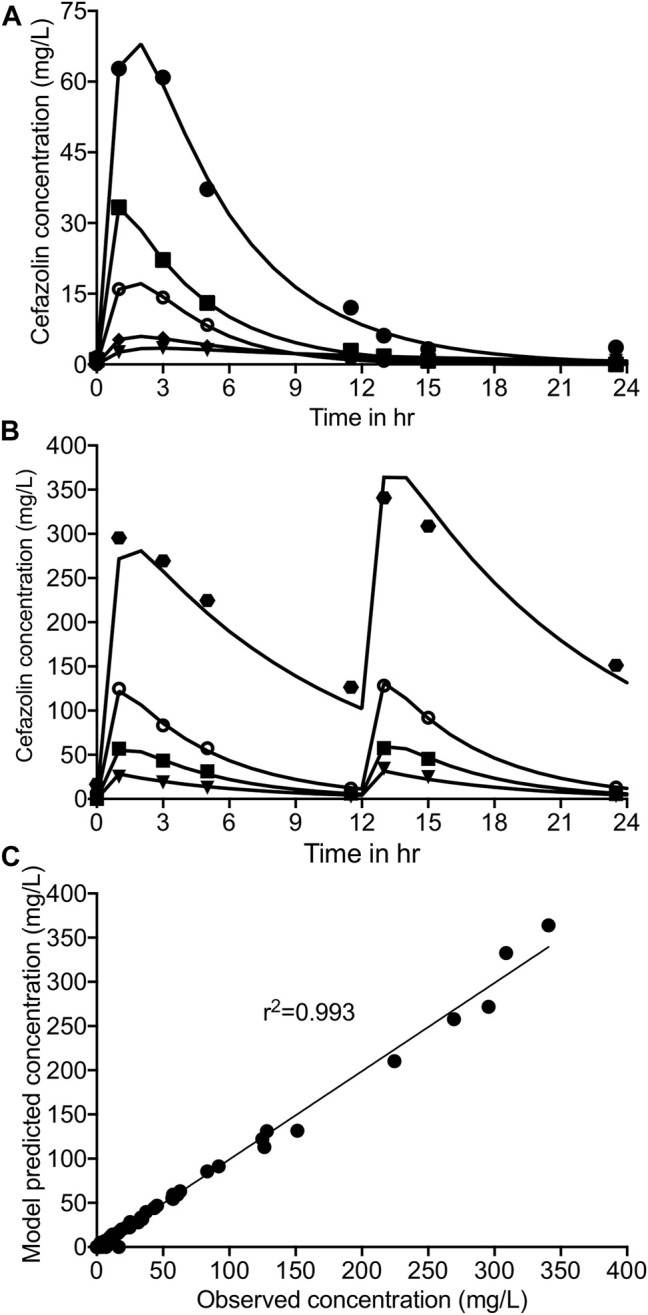
Cefazolin concentration-time profile in the HFS-TB. Symbols show the drug concentration measured in the HFS-TB, whereas solid line represent the model predicted concentrations. Cefazolin concentration time profile (A) with once daily dosing, (B) with twice-daily dosing schedule of cefazolin in the HFS-TB. (C) Model fit to show minimal bias between the cefazolin concentration measured in the HFS-TB vs the pharmacokinetics model predicted concentration.