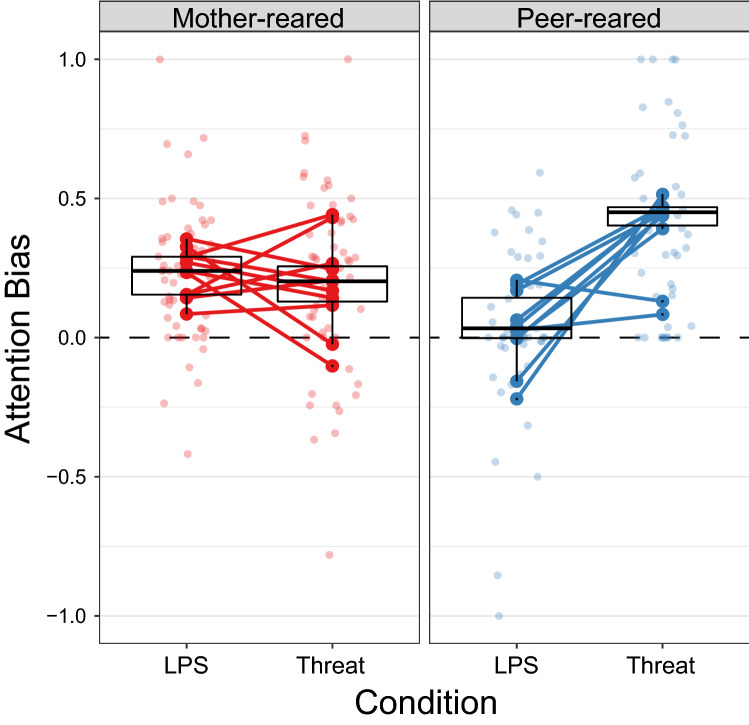
Figure 2.
Attention biases in the Neutral-LPS and Neutral-threat conditions, for the mother-reared group (red; left) and peer-reared group (blue; right). Zero indicates no bias, positive values a bias towards LPS or threat versus neutral, and negative values a bias towards neutral versus LPS or threat. Light-coloured dots represent the bias in each trial, large dark-coloured dots indicate the average bias for each subject, and lines connect the average bias in the two conditions per subject. The median bias per group, first and third quartiles, and + or − 1.5 times the inter-quartile range from the first and third quartiles are also shown in the box plots.

