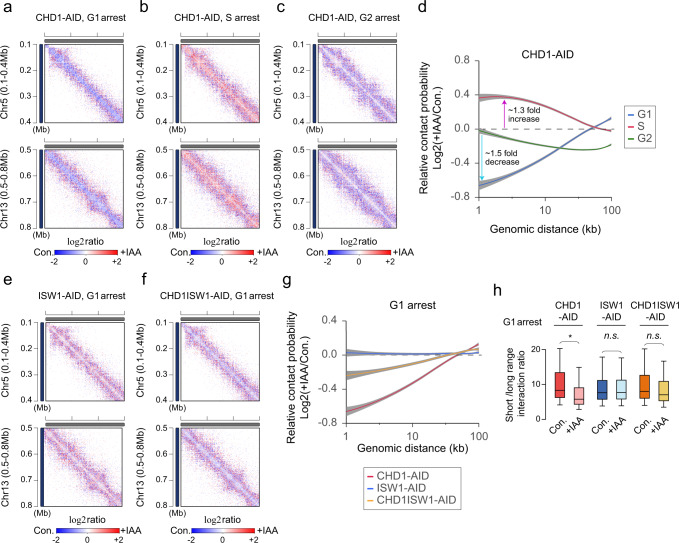
Fig. 2. The function of Chd1p in 3D genome organization is distinct from that of Isw1.
a–c Zoom-in log2 ratio contact map of chromosome 5 (0.1–0.4 Mb region; upper panel) and chromosome 13 (0.5–0.8 Mb region; lower panel) in CHD1-AID strain at G1, S, and G2 phases, respectively. The 1-kb resolution matrices of control and knockdown samples were used for log2 ratio calculations. d Log2 ratio of the average contact probability (CP) along genomic distance between control (Con.) and IAA-treated (+IAA) CHD1-AID strains at G1, S, and G2 phases. The gray shadow indicates the confidence interval around smooth (se). e, f Same as described for a but in ISW1-AID and CHD1ISW1-AID strains at G1 phase. g Log2 ratio of the average contact probability (CP) along genomic distance between control (Con.) and IAA-treated (+IAA) CHD1-AID, ISW1-AID, and CHD1ISW1-AID strains at G1 phase. The gray shadow indicates the confidence interval around smooth. h Comparison of the short-versus-long range interaction (SVL) ratio per chromosome (n = 16) relative to 100 kb in CHD1-AID, ISW1-AID, and CHD1ISW1-AID strains at G1 phase. The p-values were calculated using a one-sided Wilcoxon rank-sum test (*<0.05 and n.s. means not significant, the p-value of CHD1-AID; 0.041). Boxplot show median; box limits, upper and lower quartiles; whiskers.

