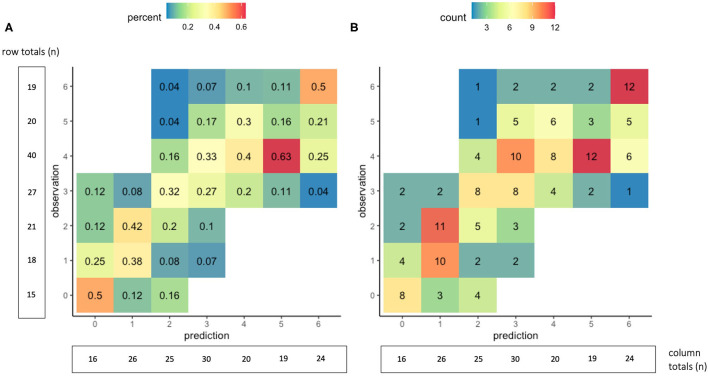
Figure 1.
Accuracy of the 90-day mRS prediction model in external validation. The graphs show cross-tabulations between the observed and predicted values of the 90-day mRS for the 160 patients in the external validation group. Values in graph (A) show proportions, where the columns represent the distribution of observed outcomes for a given predicted outcome. For example, of the 16 patients with a predicted mRS score of 0, the observed 90-day mRS score was 0 in 50%, one in 25%, two in 12.5%, and three in 12.5%. Values in graph (B) show counts of the observed and predicted mRS scores at 90 days.

