Fig. 5.
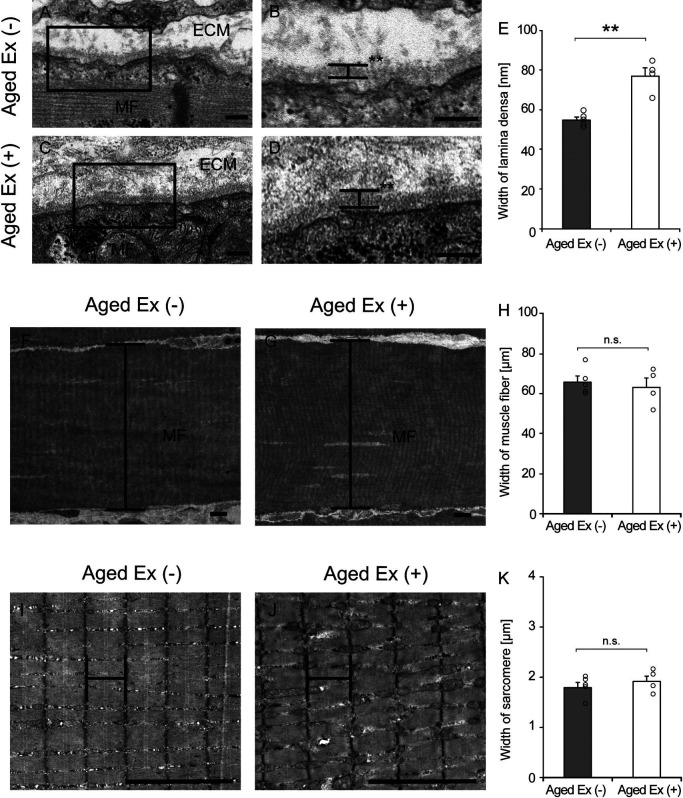
Electron microscopy analysis. Longitudinal ultrathin sections of the soleus muscles were examined using transmission electron microscopy (TEM) in Aged Ex (−) (n = 5) and Aged Ex (+) (n = 4) rats. Muscle fiber (MS) and extracellular matrix (ECM) images of Aged Ex (−) (A and B) and Aged Ex (+) (C and D) rats are presented. B and D are extended images of the black rectangles in A and C (×7000). Bar = 200 nm (A–D). An increase in the width of the lamina densa was observed in Aged Ex (+) rats (D) compared to that in Aged Ex (−) (B). The width of the lamina densa (E) was measured in the Aged Ex (−) (n = 5) and the Aged Ex (+) (n = 4) rats. MS images of Aged Ex (−) (F) and Aged Ex (+) (G) rats are presented (×300). The width of the MS (H) was measured in the Aged Ex (−) (n = 5) and the Aged Ex (+) (n = 4) rats. Sarcomere images of Aged Ex (−) (I) and Aged Ex (+) (J) rats are presented (×2000). The width of the sarcomere (K) was measured in the Aged Ex (−) (n = 5) and the Aged Ex (+) (n = 4) rats. Bar = 5 μm (F, G, I and J). **p < 0.01 vs. Aged Ex (−). Data are shown as mean ± standard error of the mean (SEM).

