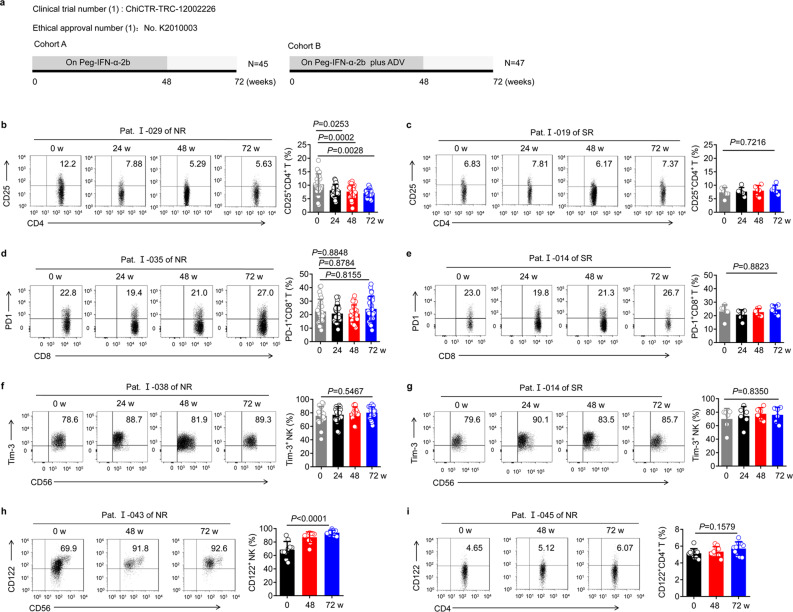
Fig. 1.
Reduced CD25 expression on CD4+ T cells after Peg-IFN-α-2b therapy. a The schematic representation of the study flow of the first clinical trial. b–g Data are analyzed and quantified for the peripheral blood mononuclear cells (PBMCs) of non-responder (NR) (α-2b) patients (n = 26) and seroconversion response (SR) patients (n = 6) at 72 weeks (48 weeks of Peg-IFN-α-2b + ADV therapy and 24 weeks of follow-up) from the start of therapy. Flow cytometry showing sequential proportion of CD25+CD4+ T cells from PBMCs of NR (α-2b) patients (b) and SR patients (c) over the course of the treatment; sequential PD-1 expression on CD8+ T cells from PBMCs of NR (α-2b) patients (d) and SR patients (e) during therapy; sequential Tim-3 expression on NK cells from PBMCs of NR (α-2b) patients (f) and SR patients (g) during therapy. For b to g, left: representative density plots of a representative sample. Right: statistical analysis of data from all samples. h, i Representative density plots (left) and percentage analysis (right) of CD122+ NK cells (h), and CD122+CD4+ T cells (i) from PBMCs of NR (α-2b) patients over the course of the treatment. n = 10. Data are analyzed by one-way ANOVA with Tukey’s multiple comparisons test. *P < 0.05; **P < 0.01; ***P < 0.001; ****P < 0.0001, and presented as mean ± SD

