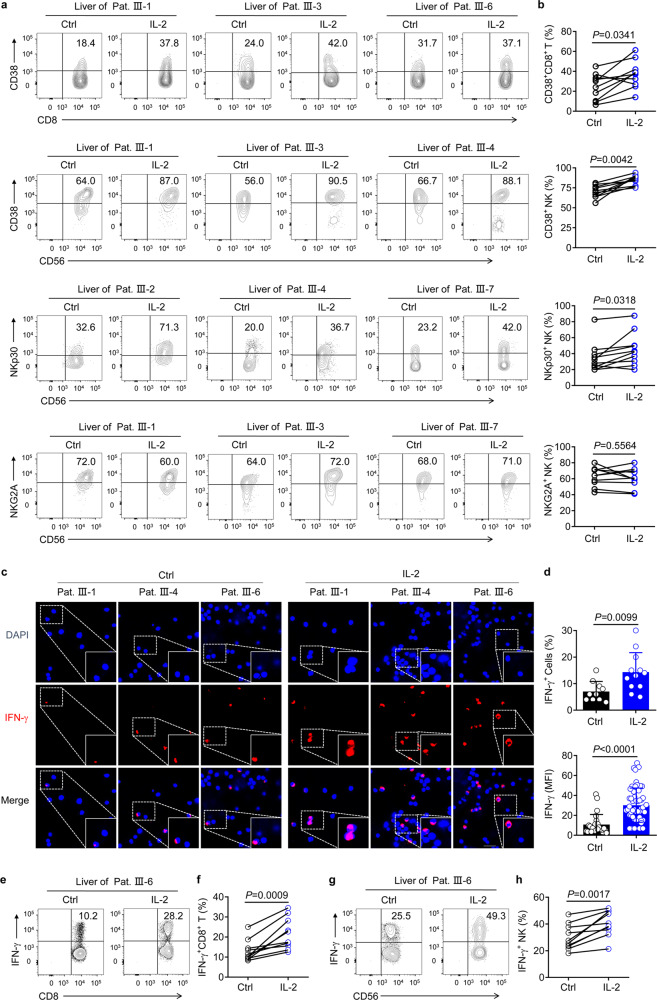
Fig. 2.
Improvement in the effector functions of lymphocytes derived from the liver biopsies of CHB patients, after IL-2 treatment ex vivo. Mononuclear cells were isolated from liver biopsies of patients with CHB, and stimulated with or without IL-2 (500 U/mL) overnight. a, b Representative density plots (a) and quantification (b) of CD38, NKp30, and NKG2A expression in gated CD8+ T cells and NK cells from liver biopsies, after IL-2 stimulation; n = 10. c Confocal microscopy analysis of IFN-γ expression in mononuclear cells from CHB patient liver biopsies, after IL-2 stimulation overnight, followed by treatment with monensin for 4 h. Scale bar = 20 µm. d (Upper) Statistics were based on the percentage of IFN-γ+ mononuclear cells isolated from liver biopsies per field of each group; each dot represents the percentage of IFN-γ+ mononuclear cells in one field. The total number of fields counted in each group without (Ctrl) and with IL-2 stimulation was 10 and 12, respectively. (Lower) Statistics were based on the MFI of IFN-γ from randomly selected single cell from each group; each dot represents the MFI of IFN-γ in one cell. The total number of IFN-γ+ cells in each group without and with IL-2 stimulation was 24 and 53, respectively. e–h Representative flow cytometry plots (e, g) and pooled data (f, h) were presented showing frequencies of IFN-γ+CD8+ T cells (e, f) and IFN-γ+ NK cells (g, h) in mononuclear cells isolated from liver biopsies, after being stimulated without or with IL-2 overnight, followed by being stimulated with PMA for 4 h. Data are analyzed by two-tailed paired Student’s t test (b, f, h), and two tailed unpaired Student’s t test (d); *P < 0.05; **P < 0.01; ***P < 0.001; ****P < 0.0001. Data are presented as mean ± SD

