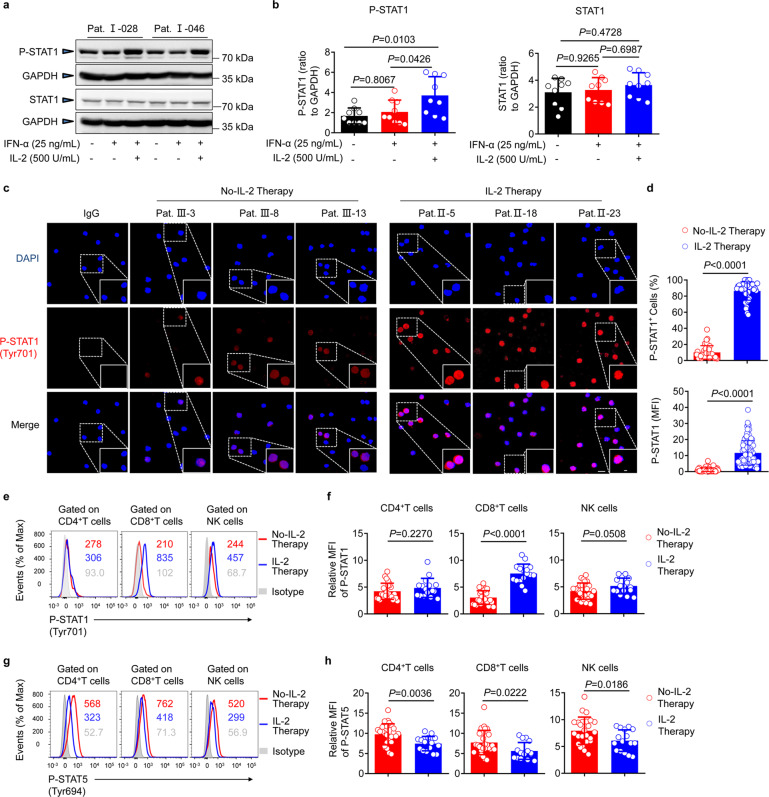
Fig. 4.
Increased P-STAT1 and decreased P-STAT5 expression after sequential IL-2 therapy in vivo. a Western blotting analysis of P-STAT1 and STAT1 levels in PBMCs of NR (α-2b) patient at week 72 (72 w; 48 weeks of Peg-IFN-α-2b therapy and 24 weeks of follow-up). PBMCs were stimulated with IFN-α (25 ng/mL) or co-stimulated with IL-2 (500 U/mL) for 30 min ex vivo. b Graphs on the right show the densitometric evaluation of a, confirming their significance; n = 9. c Confocal microscopy of P-STAT1 expression in the PBMCs of patients, with or without sequential IL-2 therapy for 24 weeks. d (Upper) Statistics were based on the percentage of P-STAT1+ PBMCs per field of each group; each dot represents the percentage of P-STAT1+ PBMCs in one field. The total number of fields counted in each group without (No-IL-2) and with sequential IL-2 therapy was 36 and 37, respectively. (Lower) Statistics were based on the MFI of P-STAT1 from randomly selected single cell from each group; the total number of P-STAT1+ PBMCs in each group without (No-IL-2) and with sequential IL-2 therapy was 64 and 113, respectively. Each dot represents the MFI of P-STAT1 in one cell. e, f Representative histograms (e) and relative MFI (f) of P-STAT1 expression in gated CD4+ T cells (left), CD8+ T cells (middle), and NK cells (right) within the PBMCs of NR (α-2b) patients, without (red, n = 26) or with (blue, n = 16) sequential IL-2 treatment for 24 weeks. g, h Representative histograms (g) and relative MFI (h) of P-STAT5 expression in gated CD4+ T cells (left), CD8+ T cells (middle), and NK cells (right) within the PBMCs of NR (α-2b) patients, without (red, n = 26) or with (blue, n = 16) sequential IL-2 treatment for 24 weeks. Data are analyzed by one-way ANOVA with Tukey’s multiple comparisons test (b), or two tailed unpaired Student’s t test (d, f, h); *P < 0.05; **P < 0.01; ***P < 0.001; ****P < 0.0001. Data are presented as mean ± SD

