Fig. 5.
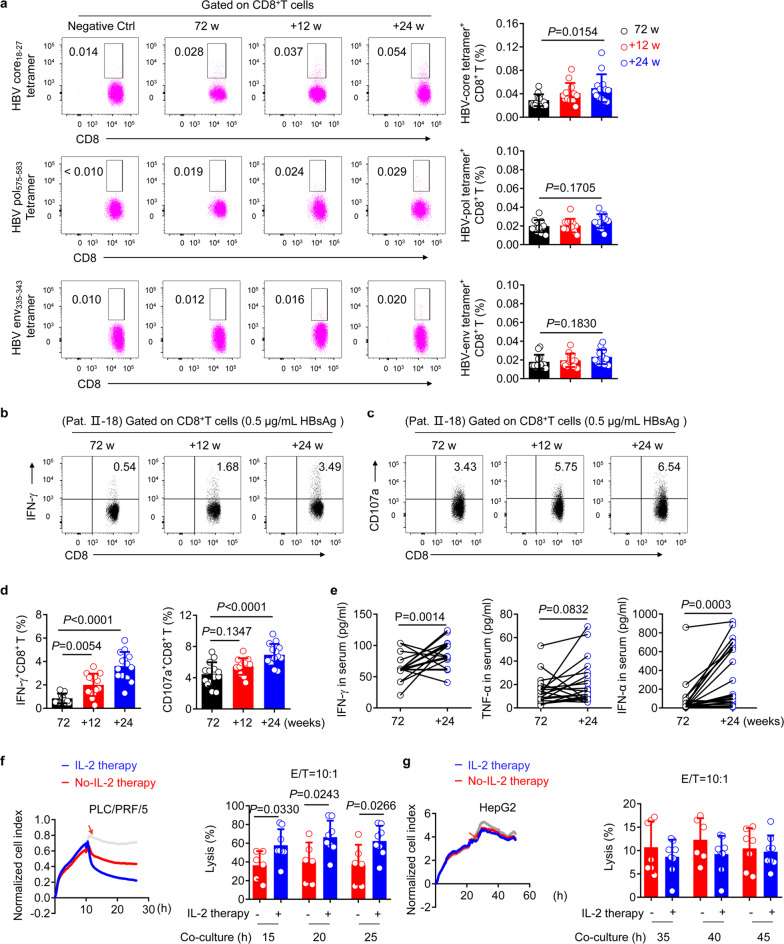
Augmentation of HBV-specific CD8+ T-cell immune responses and cytotoxicity after sequential IL-2 therapy in vivo. a Representative density plots (left panel) and pooled data (right panel) showing HBV core18-27-specific (upper), pol575-583-specific (middle), and env335-343-specific (lower) CD8+ T cells gated on live CD3+ T cells from PBMCs of NR patients at week 72 (72 w; 48 weeks of IFN-α-2b therapy and 24 weeks of follow-up), and after sequential IL-2 therapy for 12 (+12 w), and 24 (+24 w) weeks; n = 13. b, c PBMCs were treated with HBsAg (0.5 μg/mL) for 3 days. A representative image of intracellular cytokine staining is presented showing IFN-γ (b) and CD107a (c) expression on CD8+T cells. d Pooled data relating to the analyses of (b) and (c); n = 14. e IFN-γ (left), TNF-α (middle), and IFN-α (right) levels in serum were detected by ELISA at 72 w (black), and at the end of 24 weeks (+24 w) of sequential IL-2 therapy (blue); n = 23. f Time-dependent dynamic curve of the cell index (left) obtained by real-time cell analysis for PLC/PRF/5 cells after co-culture with purified CD8+ T cells from the PBMCs of patients (effector to target ratio (E/T) = 10:1), with (n = 8) or without (n = 6) IL-2 therapy for 24 weeks. Quantification (right) of CD8+ T-cell cytotoxicity measured with a real-time cell analyzer (RTCA). g Time dynamic curve of the cell index (left) obtained by RTCA for HepG2 cells under the same conditions as f, and quantification (right) of CD8+ T-cell cytotoxicity. Data are analyzed by one-way ANOVA with Tukey’s multiple comparisons test (a, d) or two-way ANOVA (f, g), or two-tailed paired Student’s t test (e); *P < 0.05; **P < 0.01; ***P < 0.001; ****P < 0.0001. Data were presented as mean ± SD

