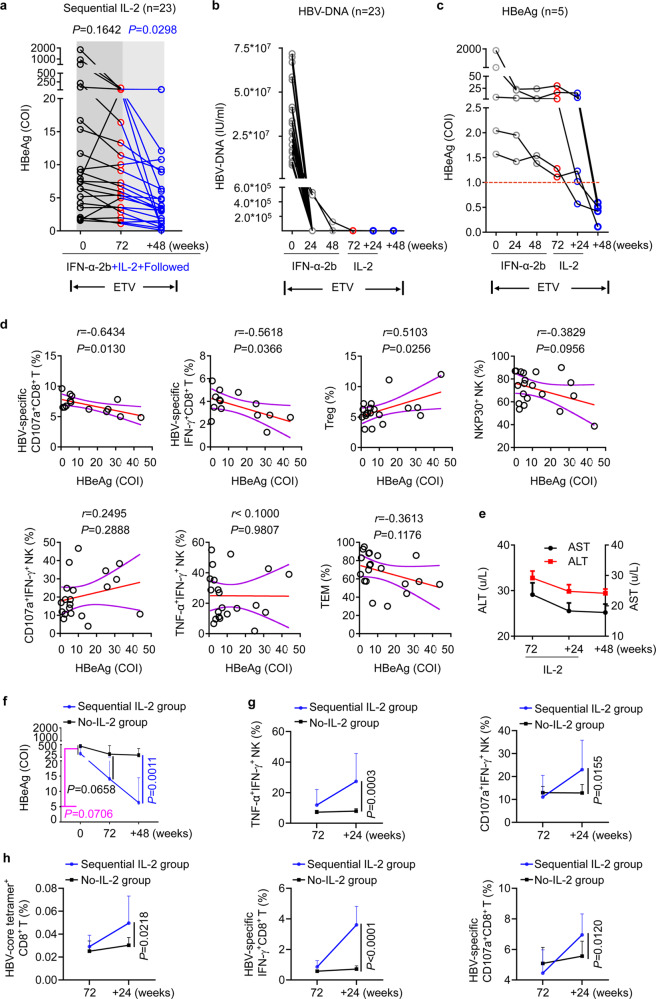
Fig. 6.
Improvement in clinical outcomes after sequential IL-2 therapy in vivo. a, b Cumulative data showing serum HBeAg levels (COI, cut-off index) (a) and HBV DNA levels (b) through IFN-α therapy (72 weeks; 48 weeks of IFN-α-2b + ETV therapy and 24 weeks of follow-up), sequential IL-2 therapy and follow-up (+48 weeks). n = 23. Data are analyzed by Wilcoxon matched-pairs signed rank test. c Dynamic curves indicating HBeAg levels for five patients who achieved HBeAg clearance through treatment. d Spearman’s rank correlation coefficient comparing HBeAg levels and the proportion of the indicated molecules at the end of the 24-week sequential IL-2 therapy. The Spearman correlation coefficient (r) and P value were shown. e The alanine aminotransferase (ALT; red) and aspartate aminotransferase (AST; black) levels of patients during and after IL-2 therapy. f The serum HBeAg levels of patients with (blue; n = 23) or without (black; n = 15) sequential IL-2 therapy were shown. g, h The proportions of TNF-α+IFN-γ+ NK cells, CD107a+IFN-γ+ NK cells (g), HBV core18-27 tetramers+ CD8+ T cells, HBV-specific IFN-γ+ CD8+ T cells and CD107a+ CD8+ T cells (h) in the sequential IL-2 group and the no-sequential IL-2 group at 72 weeks and +24 weeks (+24 w) timepoints. Data are analyzed by Mann–Whitney U test for f, and two tailed unpaired Student’s t test for g and h; *P < 0.05; **P < 0.01; ***P < 0.001; ****P < 0.0001. Data are presented as mean ± SD

