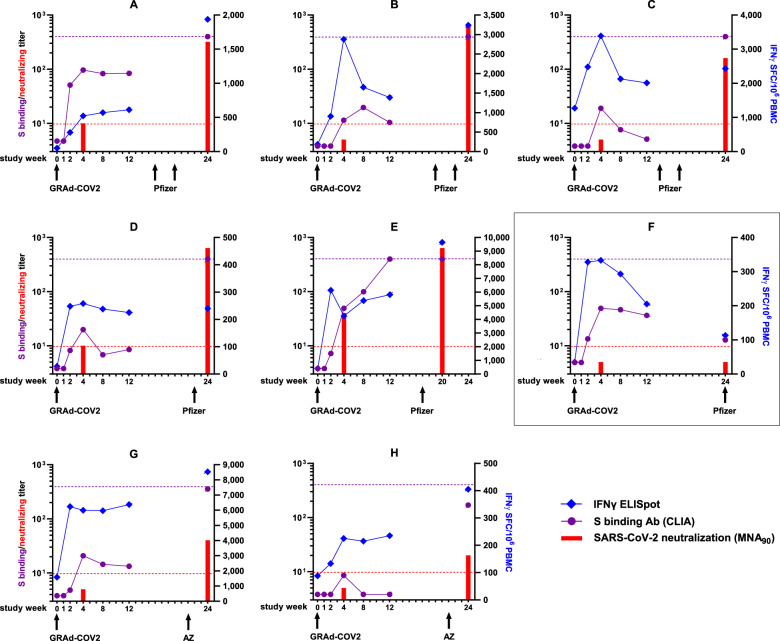
Fig. 1. Immunogenicity profile of GRAd-COV2-vaccinated volunteers receiving approved COVID-19 vaccines.
Each graph corresponds to an individual volunteer, as indicated by the code in the graph title. Subjects who received 2 doses of Pfizer (Panels A-C), 1 dose of Pfizer (Panels D-F) or 1 dose of ChAdOx1 (Panels G-H) are shown. Arrows at the graph bottom indicate study week when each GRAd-COV2 or Pfizer (BNT162b2)/AZ (ChAdOx1-nCoV19) vaccination was received. Numbers on the x axis indicate timing in weeks from GRAd-COV2 vaccination when a study visit occurred. The purple round symbols indicate Spike-binding IgG levels, as measured by CLIA assay and expressed in arbitrary units (AU)/ml. The red bars at w4 and 24 show SARS-CoV-2-neutralizing antibody titers, expressed as MNA90. Both serological endpoints are plotted against the left y axis. Purple dotted line set at 400 AU/ml indicates the upper limit of quantification for CLIA. Dotted red line indicates positivity threshold for the MNA assay, i.e., a neutralization titer of 1:10 or higher is deemed positive. The blue diamond symbols show Spike-specific T-cell response as measured by IFNγ ELISpot, expressed as IFNγ spot forming cells (SFC)/million PBMC, and plotted against the right y axis. The box highlights the subject F, receiving the booster dose only three days before the week-24 visit.

