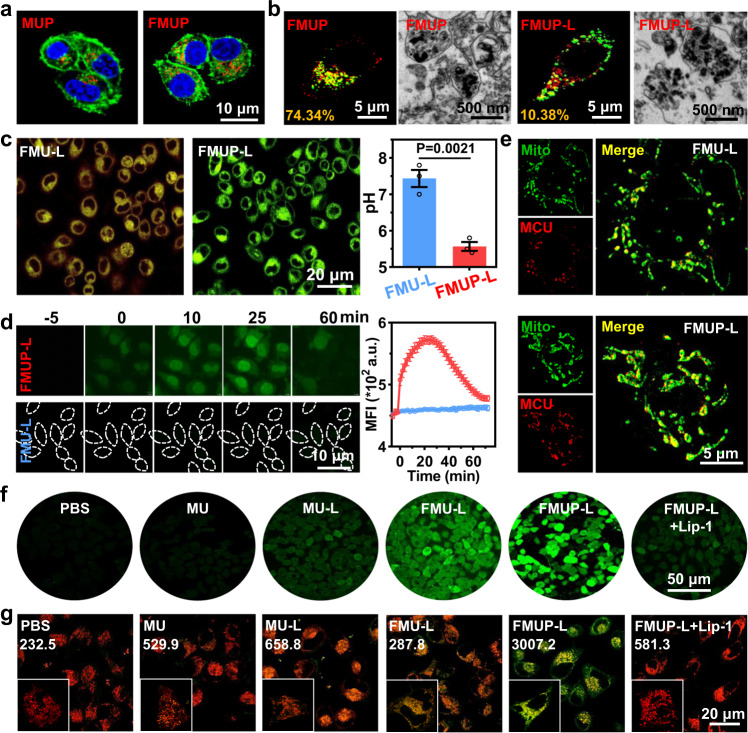
Fig. 3. In vitro assessment of the effect of CDT/acidification synergism on mitochondria.
a CLSM images of MUP and FMUP in HeLa cells. Green: cell membrane; Red: MOFs; Blue: nuclei. b CLSM images and TEM images of lysosomal escape of different treatments (FMU-L and FMUP-L). Green: lysosome; Red: MOFs. The number in the lower left corner represents the co-localization rate. c CLSM images and further quantitative analysis of pH value in different groups (FMU-L and FMUP-L). The greener the cell, the more acidic it is. d CLSM images of calcium influx in group of FMU-L and FMUP-L and corresponding quantitative analysis. Green: Ca2+. The outline of dotted line represents the cell. e CLSM images of the expression of mitochondrial calcium uniporter (MCU) in the mitochondria. The higher the expression of MCU, the stronger the calcium overload in mitochondria. Green: mitochondrial; Red: MCU. f Detection of ROS production in HeLa cytoplasm by DCFH-DA with different treatments. Green: ROS. g Detection of lipid peroxidation in HeLa cells by Liperfluo with different treatments. The statistical value in the figure represents the level of lipid peroxidation. Green: lipid peroxidation; Red: mitochondria. Data in (c) and (d) were represented as mean values ± SD, n = 3 biologically independent samples in (c) and (d). A representative image of three biologically independent samples from each group is shown in (a–g). P value was calculated by the two-tailed Student’s t test in (c).

