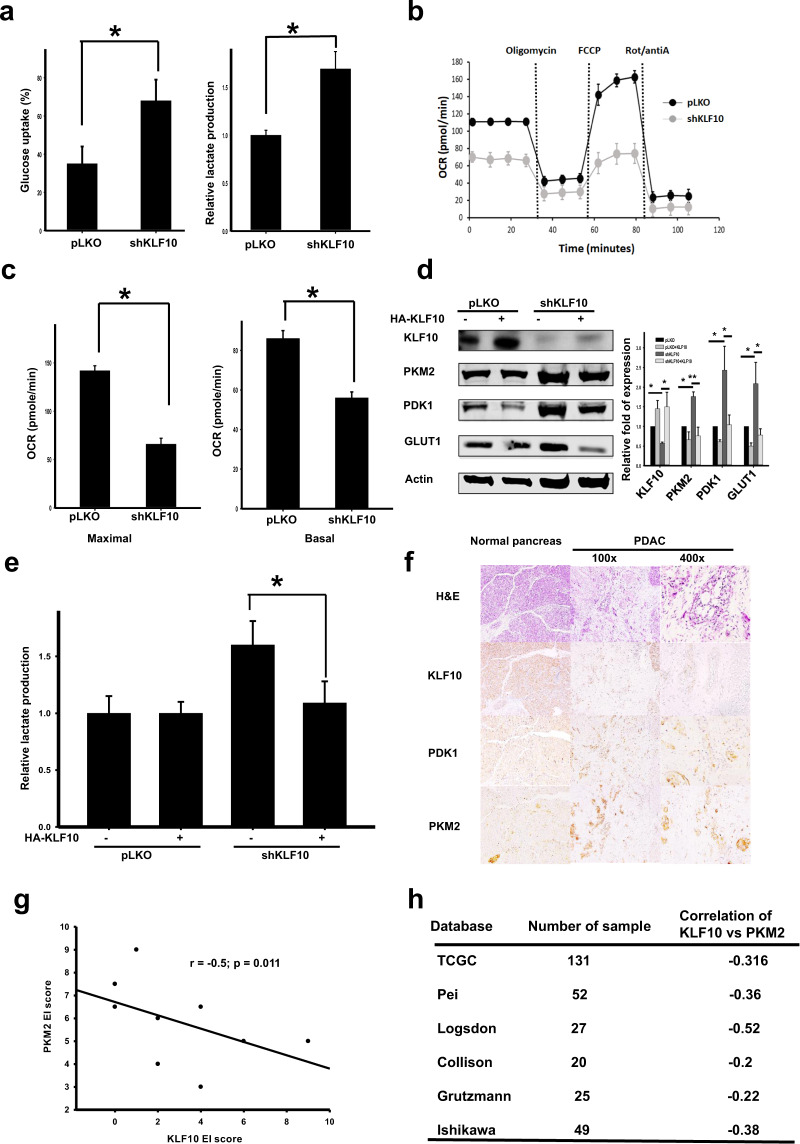
Fig. 2. Loss of KLF10 correlated with enhanced glycolysis in PDAC.
a Cumulated data of glucose uptake (left panel) and lactate production assays (right panel) in Panc-1pLKO and Panc-1shKLF10 cells. Data are presented as the mean ± SE (* signifies p < 0.05). The experiments were repeated three times. b Representative oxygen consumption rate in Panc-1pLKO (black) and Panc-1shKLF10 (gray) cells in response to oligomycin, carbonyl cyanide-p-trifluoromethoxyphenyl-hydrazon (FCCP), antimycin A (antiA), and rotenone (Rot). The results were normalized according to cell number and are presented as the mean ± SE (n = 3). c Basal and maximal respiration were determined in the same experimental setting for Panc-1pLKO and Panc-1shKLF10 cells in (b). d Representative immunoblots of KLF10 and glycolytic enzyme expression in Panc-1pLKO and Panc-1shKLF10 cells with and without KLF10 replacement. β-Actin was used as the internal control. Quantitative analysis of at least three independent experiments is shown beside the immunoblots. e Cumulated lactate production assay data of Panc-1pLKO and Panc-1shKLF10 cells with and without KLF10 replacement. Data are presented as the mean ± SE (* signifies p < 0.05). f Representative hematoxylin and eosin (H&E) staining and immunohistochemistry of KLF10, PKM2, and PDK1 in nontumor normal pancreas and pancreatic tissues (×100 and ×400 for the middle and right panels, respectively) from patients with curatively resected PDAC. g Correlation of immunolabeling of KLF10 with PKM2 from the pancreatic tissues of 10 patients from the cohort mentioned in the “Materials and methods” section of PDAC patients who underwent curative resection. The correlation coefficient = −0.5, p = 0.011. h Representative six databases from Oncomine with correlated levels of KLF10 and PKM2 transcripts.

