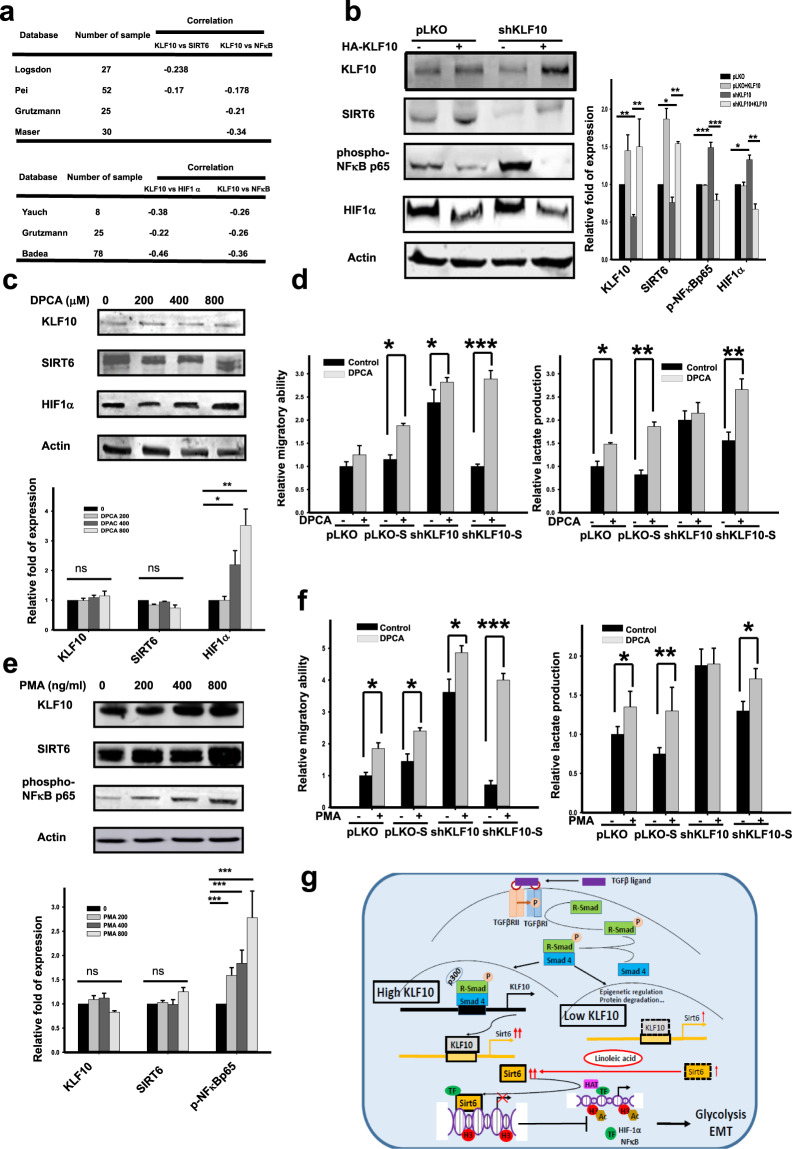
Fig. 6. HIF1α and NFκB are two downstream mediators of KLF10/SIRT6 signaling in PDAC cells.
a Representative databases from Oncomine display the correlation between KLF10 (upper panel)/SIRT6 (lower panel) and HIF1α or NFκB transcripts. b Representative immunoblots of HIF1α and phospho-NFκBp65 in Panc-1pLKO and Panc-1shKLF10 cells with and without forced expression of KLF10. Quantitative analysis of cumulative data from at least three experiments is shown in addition to immunoblots. β-Actin was used as the internal control. c Representative immunoblots of HIF1α in Panc-1 cells treated with various dosages of 1,4-dihydrophenonthrolin-4-one-3-carboxylic acid (DPCA) for 8 h. Quantitative analysis from at least two experiments is shown below the immunoblots. d Left panel: Cumulated migratory assay of Panc-1pLKO and Panc-1shKLF10 cells with or without SIRT6 overexpression treated with and without 400 μM DPCA for 16 h. Right panel: Cumulated lactate production assay of Panc-1pLKO and Panc-1shKLF10 cells with and without SIRT6 overexpression that were treated with and without 400 μM DPCA for 16 h. Data are presented as the mean ± SE (n = 3) (*, ** and *** indicate p < 0.05, p < 0.01, and p < 0.005, respectively). The experiments were repeated three times. e Representative immunoblots of NFκΒ in Panc-1 cells treated with various dosages of phorbol ester (PMA) for 8 h. Quantitative analysis from at least two experiments is shown below the immunoblots. f Left panel: Cumulated migratory assay of cells treated with and without 200 ng/ml PMA for 16 h. Right panel: Cumulated lactate production assay with and without 400 ng/ml PMA for 16 h. Data are presented as the mean ± SE (n = 3; *, **, and *** indicate p < 0.05, p < 0.01 and p < 0.005, respectively). The experiments were repeated three times. g Graphic summary of the role of the KLF10/SIRT6 signaling pathway in modulating EMT and glycolysis in PDAC.

