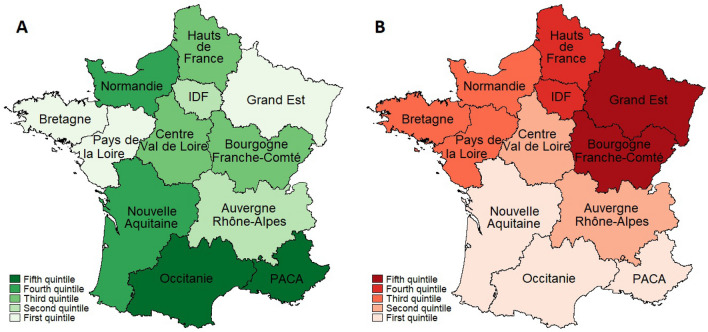
Figure 2.
Tests and death rates in metropolitan regions, France, March–May 2020. Panel (A): Test rate: number of RT-PCR tests divided by the number of patients admitted to hospitals for COVID-19. Panel (B): Death rate: number of deaths in hospitals due to COVID-19 divided by the number of patients admitted to hospitals. We used shapefiles for regions and departments to construct the maps and compute the contiguity matrix. PACA is in the top 20% of regions that test more and in the bottom 20% of regions that have the lowest fatality ratios. Data are freely
available at https://www.sae-diffusion.sante.gouv.fr/.

