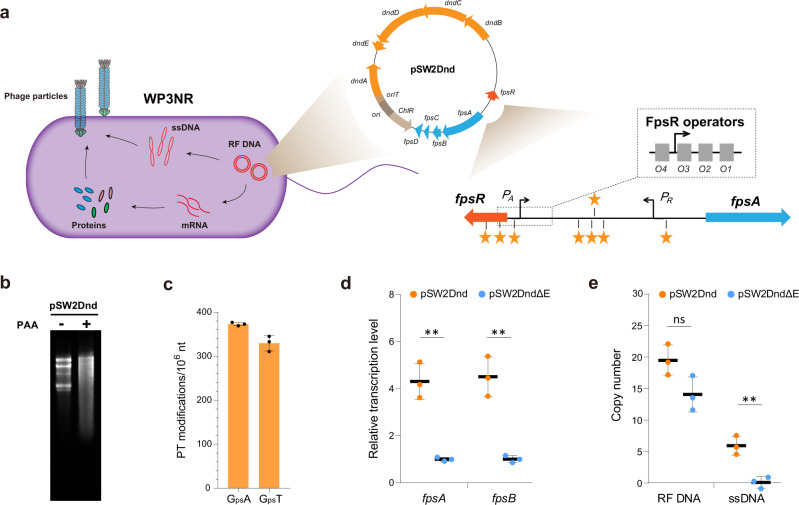
Fig. 4. PT modification influences the gene transcription and DNA replication of phage SW1.
a Schematic representation of the WP3NR- pSW2Dnd system for investigating the effect of PT modification. The double-stranded replicative forms of DNA (RF DNA), single-stranded DNA (ssDNA) and mRNA which were quantified via qPCR, are indicated in red. The promoters of fpsA (PA) and fpsR (PR) are responsible for the transcription of the SW1 structural genes fpsA-H and the regulator gene fpsR, respectively. The phage-encoded repressor FpsR binds to four operators located in PA and the intergenic region between fpsA and fpsR, thus functioning as the determinant of the genetic switch of SW1. The yellow stars indicate the putative PT modification sites. For clarity, the genes and regulatory elements are not drawn to scale. b Cleavage detection of PT modification in pSW2Dnd. Agarose gel showing the effect of treating pSW2Dnd from WP3NR/Dnd with PAA–TAE buffer. “+” and “−” represent treated and untreated plasmids, respectively. c Quantification of PT modifications (GpsA and GpsT) in pSW2Dnd. The data represent the mean ± s.d. and are based on three biologically independent samples. d Relative transcription levels (RTLs) of SW1 genes in the WP3NR/Dnd and WP3NR/DndΔE strains. e RF DNA and ssDNA copy numbers of pSW2Dnd and pSW2DndΔE. Data are represented as mean ± s.d.. and based on three biologically independent samples. The significances were analyzed by two-sided unpaired Student’s t test. Specifically, P = 0.0017 (∗∗) for fpsA and P = 0.0022 (∗∗) for fpsB of pSW2Dnd vs pSW2DndΔE; P = 0.0643 (ns, not significant) for RF DNA and P = 0.0046 (∗∗) for ssDNA of pSW2Dnd vs pSW2DndΔE. Source data are provided as a Source Data file.

