FIGURE 4.
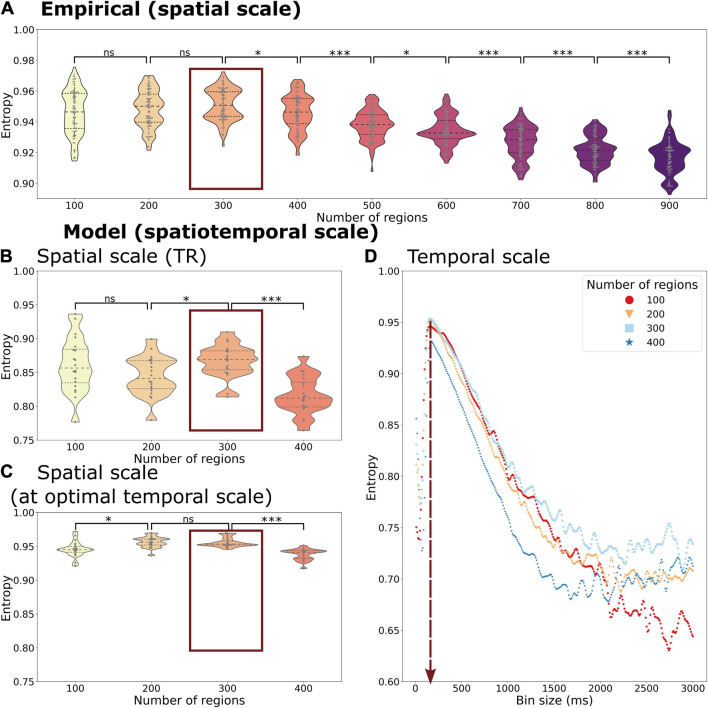
Entropy of the temporal probability of whole-brain functional networks in different spatial and temporal scales of the empirical (A) and simulated data (B–D). The entropy is calculated across spatial scales in the empirical data with a fixed temporal scale of 720 ms (corresponding to the TR). The simulated data gives the opportunity to explore different spatial scales at the temporal scale of the TR, 720 ms, (B) as well as at the optimal temporal scale of 150 ms (C). Beyond that it can be also used to explore various temporal scales and spatial scales simultaneously (C). Both the empirical and simulated data show that the highest entropy can be found at a spatial scale of 300 regions with only a minor decrease in entropy at a spatial scale of 200 regions (marked by a red box in A–C). The highest entropy can be found at a temporal scale of 150 ms across all spatial scales (vertical red arrow in D). Each datapoint depicts a random group of 10 subjects in the empirical data or a simulation trial simulating a group of 10 subjects. Statistical significance of comparisons between spatial scales is indicated with “ns” meaning a p > 0.05, * meaning < 0.05, *** meaning 0.001 (FDR-corrected).

