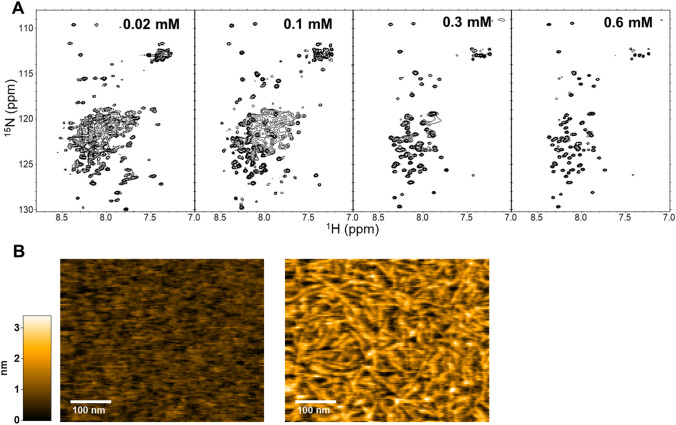
Figure 2.
Fibril formation of the CAHS1 protein in vitro. (A) 1H-15N HSQC spectra of the CAHS1 protein at protein concentrations of 0.02, 0.1, 0.3, and 0.6 mM. (B) Typical HS-AFM images of CAHS1 protein fibrils. Left: the HS-AFM image of the mica surface with CAHS1 protein at a final concentration of 0.4 μM, about 3 min after injection into the observation solution. Right: the HS-AFM image about 2 min after the addition of CAHS1 protein at a final concentration of 3.3 μM.

