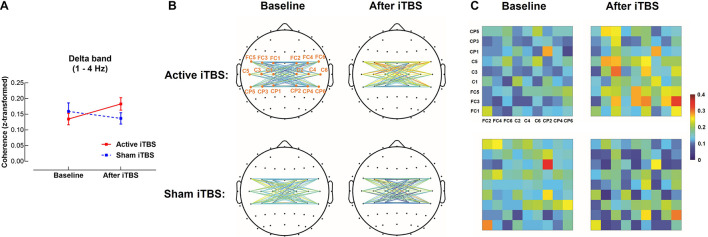
FIGURE 1.
Delta band interhemispheric functional connectivity change after iTBS. Delta band coherence between left and right sensorimotor cortices was significantly increased in the Active iTBS group, but not in the Sham iTBS group after iTBS (A). The topographies (B) and matrixes (C) represent z-scores of coherences between pairs of electrodes in the left and right sensorimotor cortices before and after iTBS in the Active and Sham iTBS groups. Warmer colors indicate greater coherence, while cooler colors indicate less coherence.

