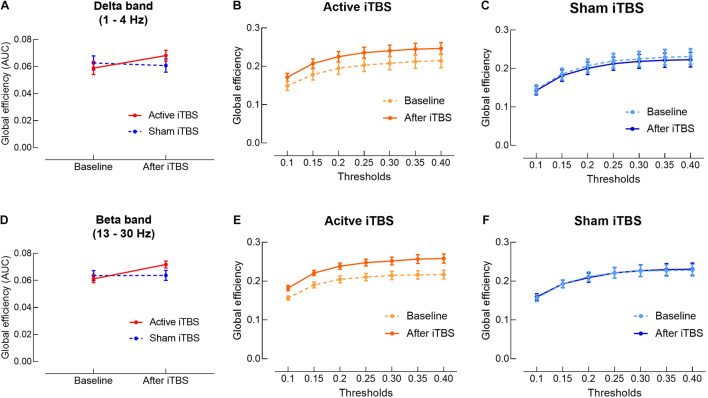
FIGURE 4.
Delta and beta bands global efficiency change after iTBS. Delta (A) and beta (D) bands global efficiency (area under the curves) were significantly increased in the Active iTBS group, but not in the Sham iTBS group after iTBS. (B,C) Delta band global efficiency at each threshold in the Active and Sham iTBS groups, respectively. (E,F) Beta band global efficiency at each threshold in the Active and Sham iTBS groups, respectively.

