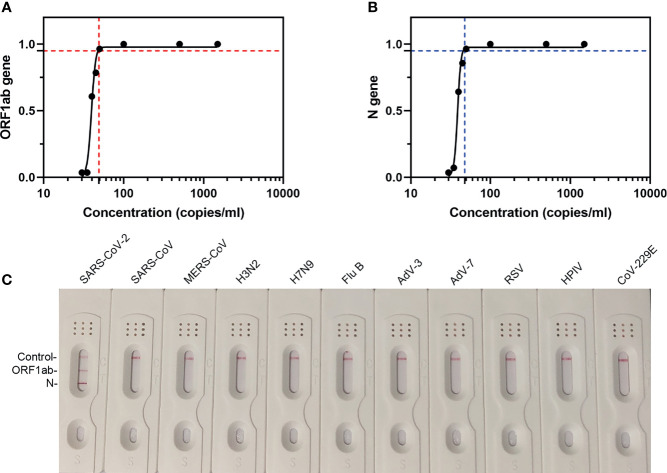
Figure 5.
The LoD and specificity of our assay. (A) LFD readout analysis of RT-MIRA amplicons in 10-fold diluted SARS-CoV-2 national references. (B) Probit analysis for the 95% LoD. The plot illustrated the relationship between the measurand concentration and probability of detection. Seven measurand concentration samples were prepared by diluting low-level SARS-CoV-2 national reference (1.5 × 10³ copies/ml). The analyte concentrations were as follows: 0, 30, 35, 40, 45, 50, 100, 500, and 1500 copies/ml. Red-dashed line indicates the 95% LOD of ORF1ab gene. Blue-dashed line indicates the 95% LOD of N gene. (C) LFD readout analysis of RT-MIRA amplicons for detection of SARS-CoV-2. H3N2, influenza A virus H3N2; H7N9, influenza A virus H7N9; Flu B, influenza B virus; RSV, respiratory syncytial virus; AdV-3, adenovirus-3; AdV-7, adenovirus-7; HPIV, human parainfluenza virus; CoV-229E, coronavirus 229E.

