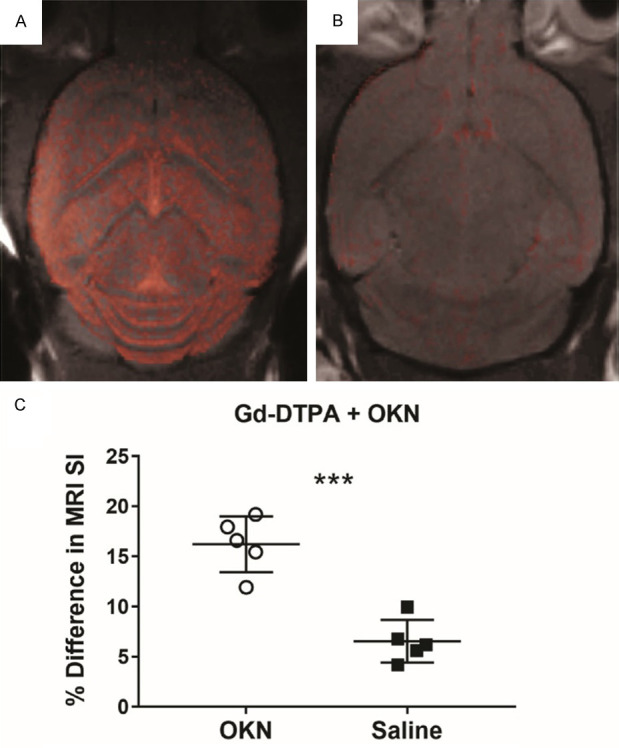
Figure 2.

Representative mouse brain difference images (post-contrast minus pre-contrast), overlaid on top of morphological images, indicating an increase in MRI signal intensities in a mouse brain administered OKN-007 (A), compared to a control mouse brain administered saline (B), both 1 hour prior to Gd-DTPA. (C) Percent (%) differences in MRI SI between post-contrast and pre-contrast, Gd-DTPA contrast-enhanced MRI (CE-MRI) in OKN-007 (n = 5) and saline-treated (i.v. administration) (n = 5) mouse brains, one hour post-contrast. There was a significant increase in the % difference in MRI SI for OKN-007-treated mouse brains, compared to saline controls (P<0.001).
