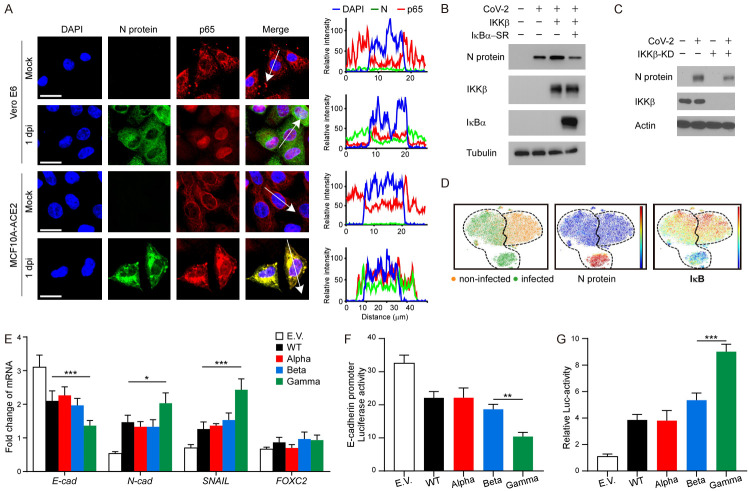
Figure 2.
S of SARS-CoV-2 Gamma variant induces a stronger EMT in breast cancer cells. A. Representative confocal microscopic images of p65 translocation in Vero E6 and MCF10A-ACE2 cells after SARS-CoV-2 infection (left panel). Scale bar, 20 μm. The plot of relative intensity through the white arrow in the left panel. B. Western blot analysis of N protein, IKKβ, and IκBα after SARS-CoV-2 infection. 293T-ACE2 cells were transiently transfected with pcDNA3 plasmid encoding p65 and IκBα-SR before SARS-CoV-2 infection. C. Western blot analysis of N protein and IKKβ after SARS-CoV-2 infection. 293T-ACE2 cells were transiently transfected with pcDNA3 plasmid encoding IKKβ-KD before SARS-CoV-2 infection. D. Immunophenotypic and signaling pathway analysis of the SARS-CoV-2 infected cell lines by CyTOF. ViSNE analysis showed non-infected (orange dots) and infected (green dots) cells (bottom left). The dashed lines indicated the ViSNE spaces for infected or non-infected cells, respectively. The expression levels of N-protein (bottom middle) and IκB (bottom right) for all analyzed cells. Red is high. Blue is low. E. qPCR analysis of E-cadherin, N-cadherin, SNAIL, and FOXC2 in MCF7 cells expressing S of SARS-CoV-2 WT, Alpha, Beta, or Gamma variants. Two-way ANOVA with Tukey’s post hoc test. *P < 0.05; ***P < 0.001. F. Luciferase reporter assay of E-cadherin. MCF7 cells were transfected with the E-cadherin reporter and S of SARS-CoV-2 WT, Alpha, Beta, or Gamma variants. One-way ANOVA with Tukey’s post hoc test. **P < 0.01. G. Luciferase reporter assay of NF-κB. One-way ANOVA with Tukey’s post hoc test. ***P < 0.001. E.V. means empty vector.

