
Figure 1.
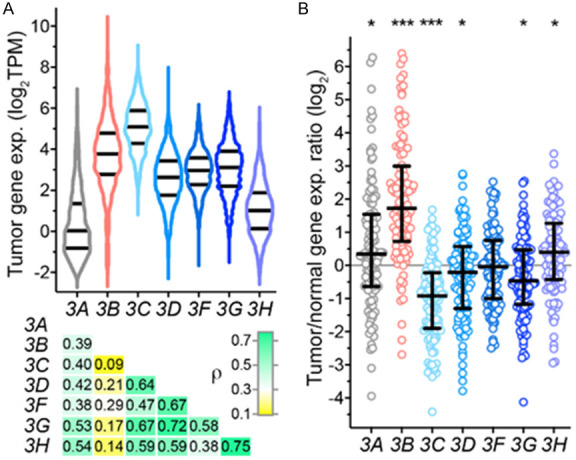
APOBEC3 gene expression in breast cancer tissues of TCGA. A. Violin plots of gene expression in 1,091 tumors with median and inter-quartile range (IQR) are shown for the seven APOBEC3 genes (3A-3H). Underneath is a heatmap of Spearman coefficients (ρ) of correlations between the various APOBEC3s. TPM, transcripts per million. B. Ratio of APOBEC3 gene expression of tumors and their matched adjacent normal breast tissue is plotted along with median and IQR values for 112 patients with data available for both tissues. Significant p values in paired tumor vs. normal comparison by Welch t test are indicated (*, < 0.05; ***, < 0.001).