
Figure 3.
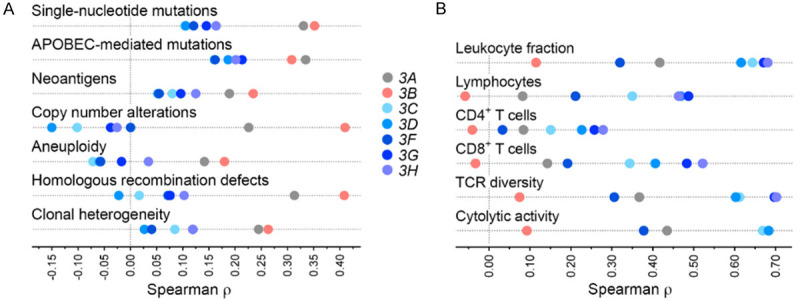
Association of APOBEC3 gene expression of breast tumors of The Cancer Genome Atlas with their cancer genome and immune characteristics. Shown are Spearman coefficient (ρ) values in analyses of correlation of gene expression of tumors with various features. A. For genome features, total and APOBEC-mediated single-nucleotide exonic mutation counts (n = 1,014 tumors with available data), counts of neoantigens predicted to arise from single-nucleotide mutations and indels (856), segments affected by copy number alteration (1,062), scorings for aneuploidy (1,034) and homologous recombination defects (1,035), and clonal heterogeneity (1,016) are analyzed. B. For immune features, coefficients are shown for infiltrating leukocyte fraction (n = 1,064 tumors with available data) and relative abundance of lymphocytes, CD4+, and CD8+ T cells among infiltrating immune cells (915), T cell receptor (TCR) Shannon diversity (1,038), and immune cytolytic activity measured as the CYT score (1,091).