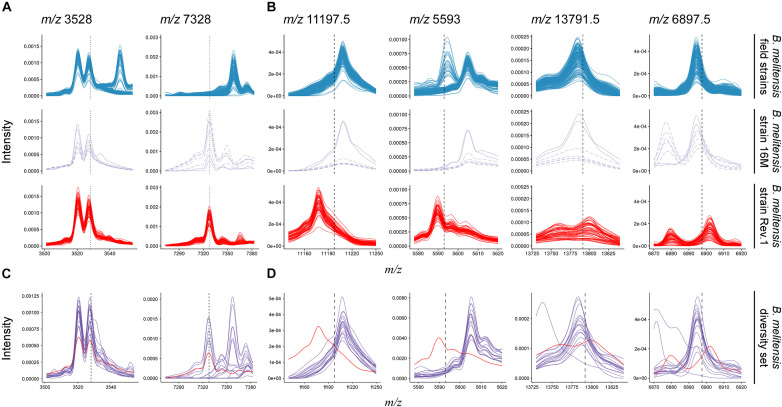
FIGURE 4.
Comparison of B. melitensis field isolate (first row) and Rev.1 (third row) spectra against the type strain B. melitensis 16M (second row) and a diversity set of B. melitensis strains (fourth row) for selected masses. (A) Putative biomarkers (vertical dotted lines) described by Christoforidou et al. (2020). All spectra in this study displayed a peak at m/z 3,528. Most Rev.1 strains as well as the B. melitensis type strain 16M displayed a peak at m/z 7,328. (B) All biomarker decision boundaries (vertical dashed lines) in this study demarcate B. melitensis Rev.1 from B. melitensis 16M and field isolates. (C,D) Spectra from a diversity set of B. melitensis MVLA8 genotypes (purple) are plotted against a group spectrum of B. melitensis Rev.1 samples (red). For clarity, only spectra acquired at the BfR are shown.

