
Figure 2. National Cannabis Retail Sales 16 Months Prior to and During the First 16 Months of the COVID-19 Pandemic in Canada.
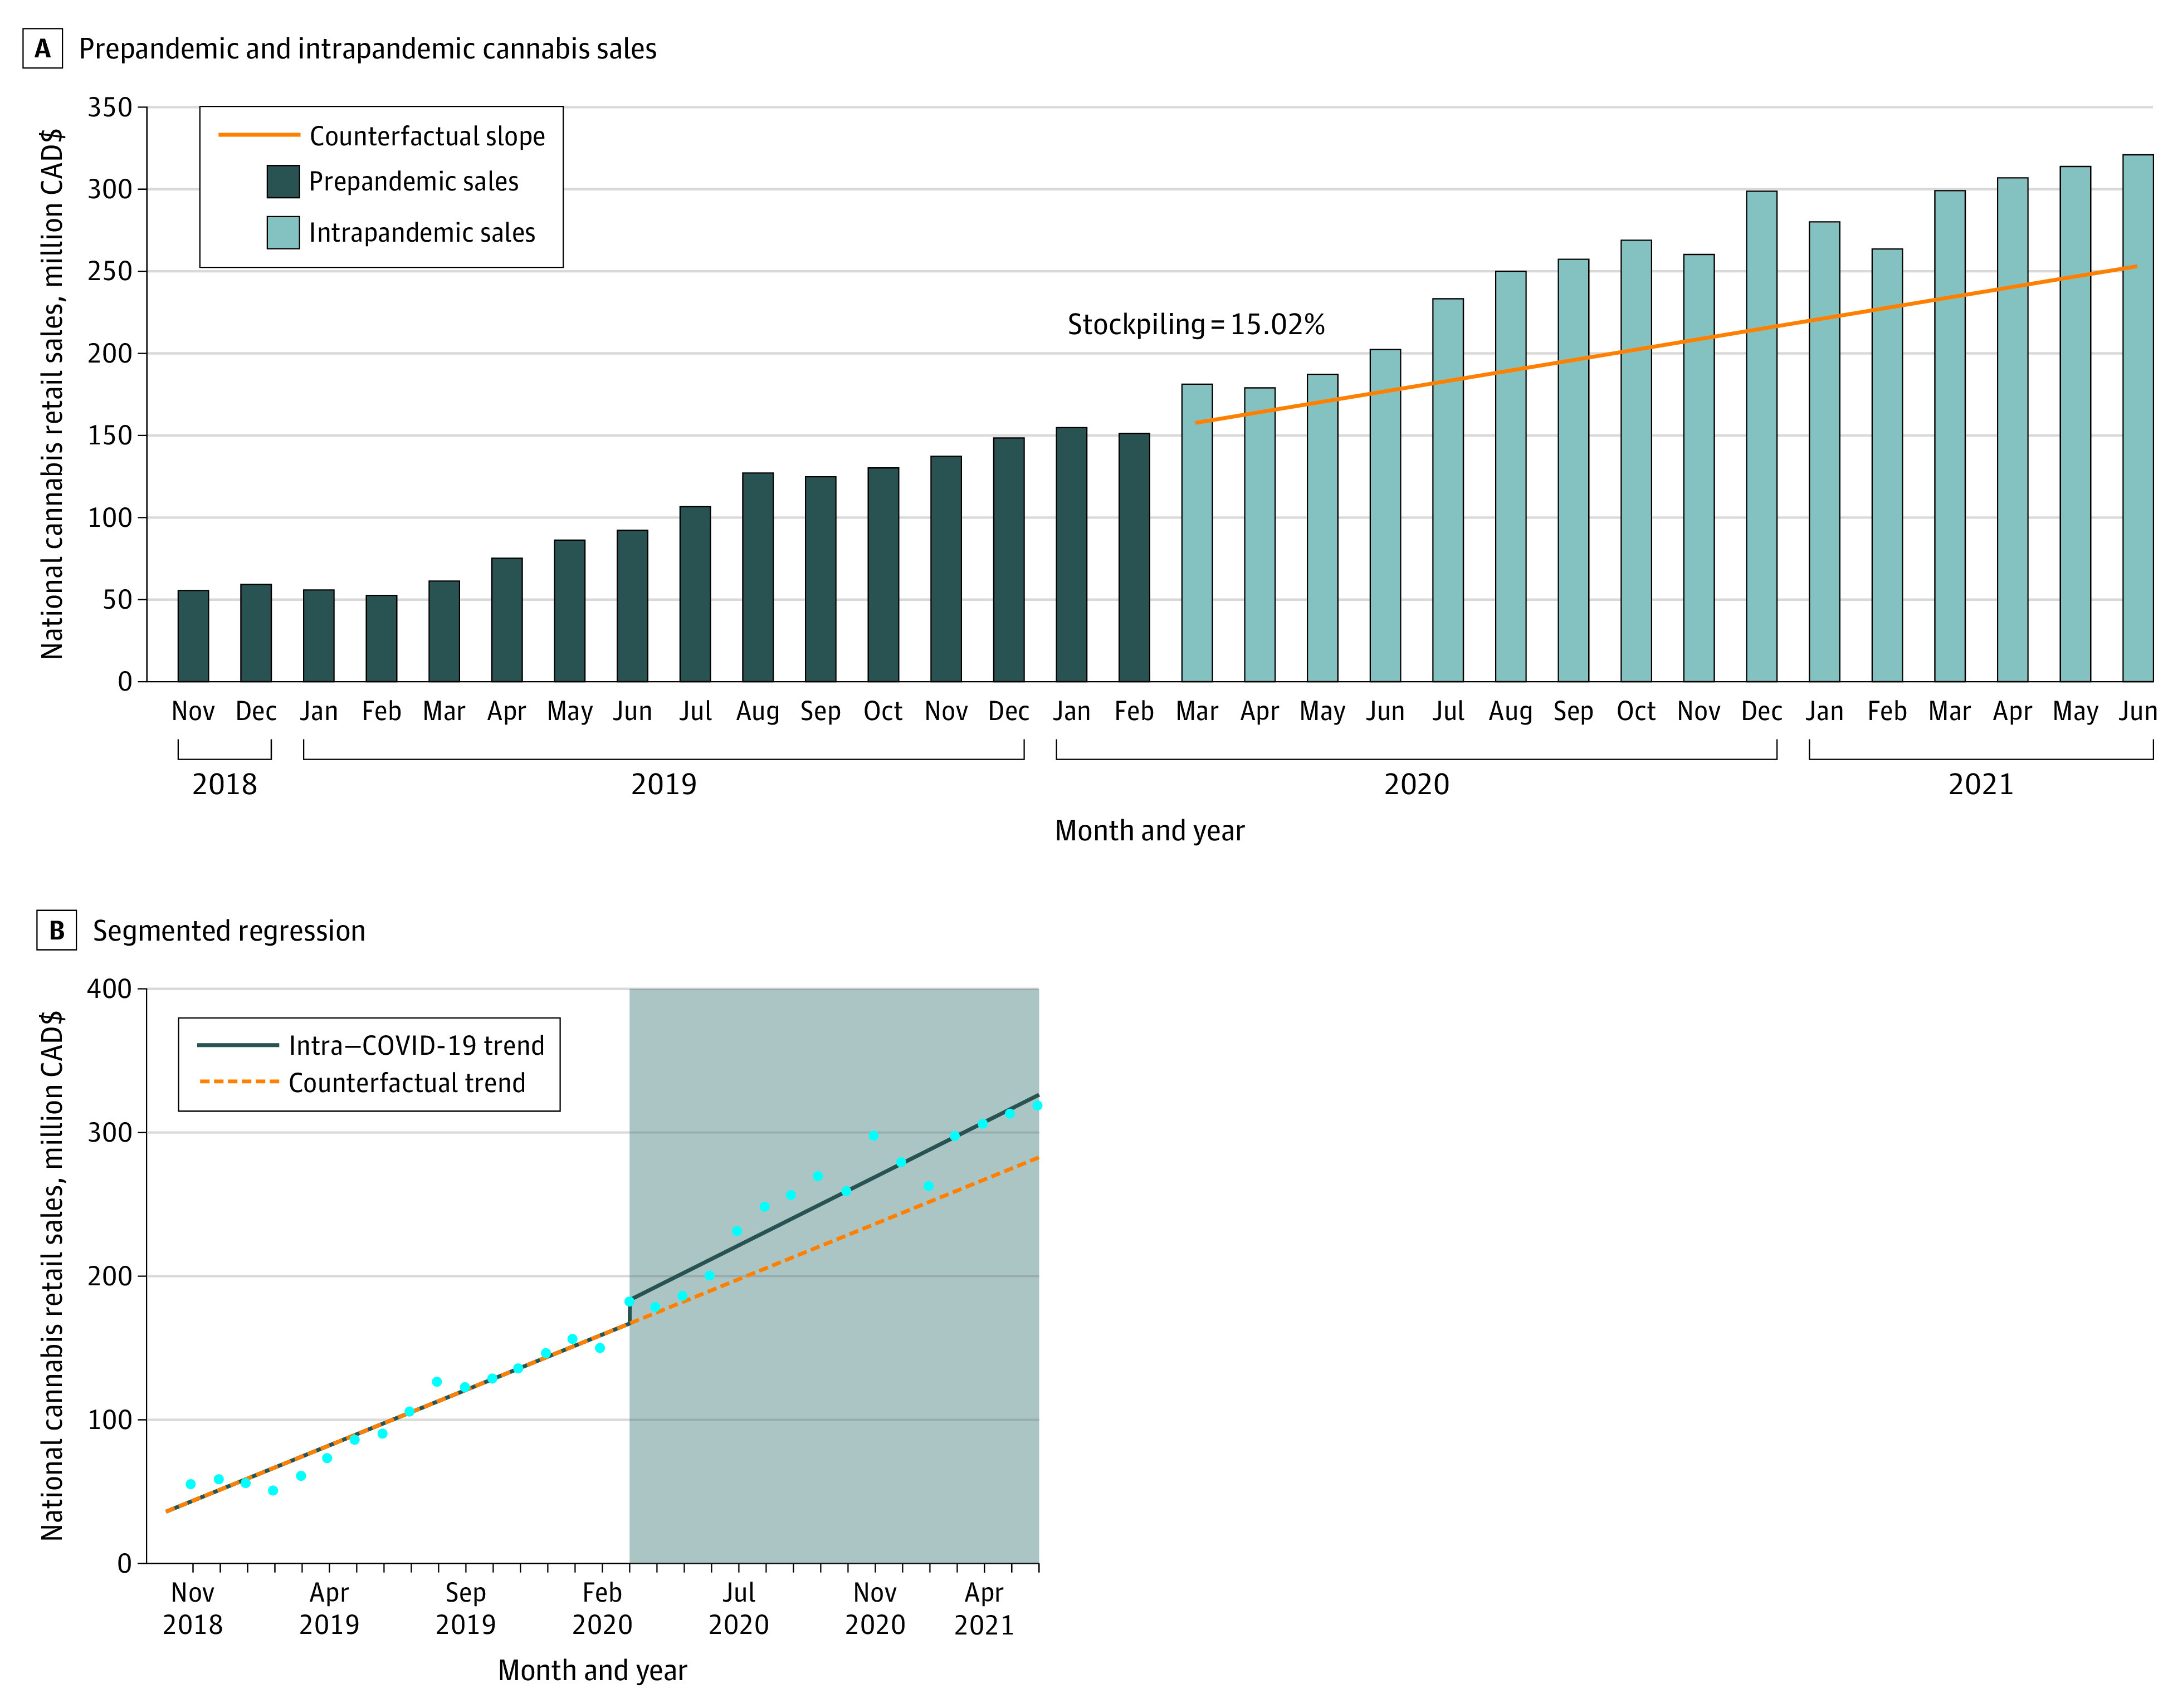
A, Dark blue bars indicate prepandemic cannabis sales; light blue bars, intrapandemic cannabis sales; orange line, linear counterfactual trend. B, Circles indicate monthly sales; solid line, intrapandemic trend; dashed line, counterfactual trend; shaded area, COVID-19 period.