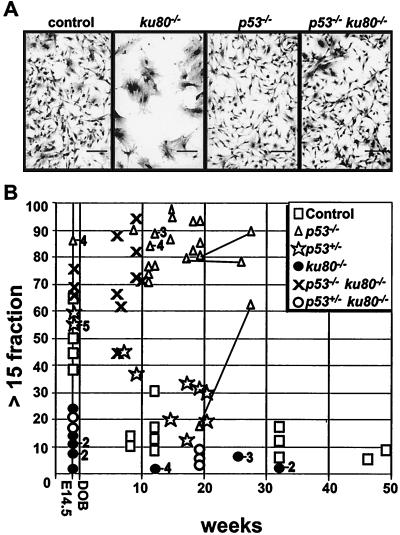
FIG. 3.
Analysis of individual cells at early passage. (A) MEF morphology. Passage 2 cells were plated (5.3 × 10⁴ cells/3.5-cm plate) and grown for 5 days before staining. Scale bar = 125 μm. (B) Cross-sectional CSD. The fraction of colonies with >15 cells out of the total number of colonies with >3 cells is shown. Symbols are the same as in Fig. 1 with the addition of a star to represent p53+/−. Numbers to the right of a symbol represent the number of clones observed at that point if greater than one. MEF were observed at passage 2 and MSF were observed at passage 1. Skin fibroblasts derived from three p53−/− mice were analyzed at two time points (joined by lines). All other points represent fibroblasts derived from different mice.

