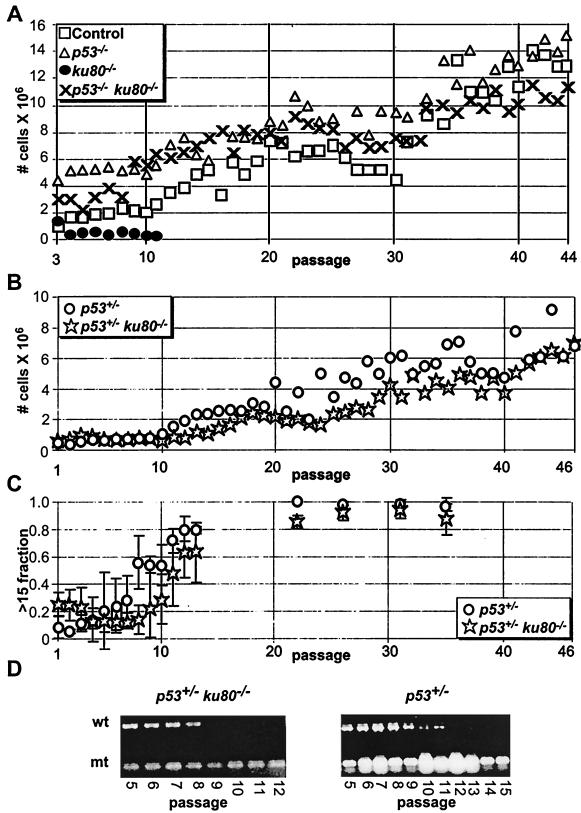
FIG. 4.
Analysis of clonal populations of cells. Symbols are the same as in Fig. 1 and 3. (A) 3T3 equivalent analysis of control, p53−/−, ku80−/−, and p53−/− ku80−/− MEF. Graph starts with passage 3 MEF. The averages of clones are shown for control (n = 2), p53−/− (n = 3), ku80−/− (n = 2), and p53−/− ku80−/− (n = 2) mice. (B) 3T3 equivalent analysis of p53+/− and p53+/− ku80−/− MSF. Graph starts with passage 1 MSF. The averages of clones are shown for p53+/− (n = 5) and p53+/− ku80−/− (n = 3) MSF. (C) Companion CSD with >15-cell fractions. The fraction of colonies with >15 cells out of the total number of colonies composed of >3 cells is shown. Cells were taken from the 3T3 equivalent analysis presented in panel B. (D) Loss of heterozygosity of p53 shown by genotyping by PCR. Wild-type (wt) and mutant (mt) bands are shown.

