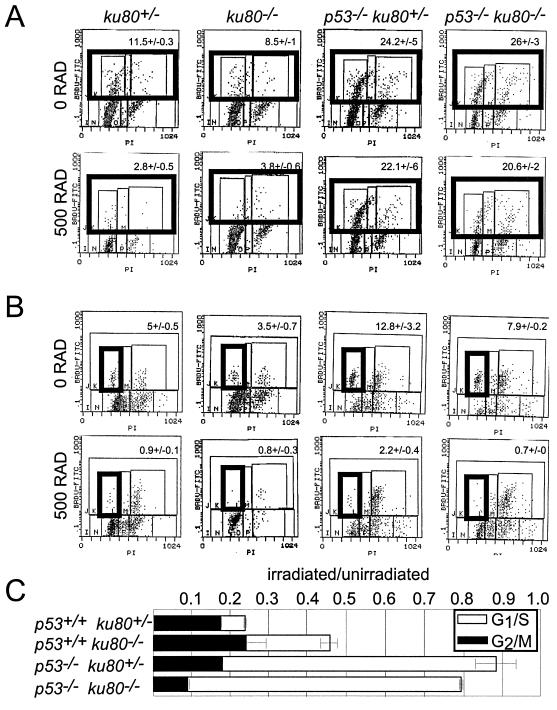
FIG. 5.
Cell cycle checkpoints induced by ionizing radiation. (A) Representative histographs for the analysis of the G1/S checkpoint exposed to either 0 or 500 rad. BrdU-labeled cells appear in the top three boxes of each histograph, which are outlined by one box in bold. The average percentage (± standard deviation) of cells labeled with BrdU is shown at the top of each histograph. (B) Representative histographs for the analysis of the G2/M checkpoint exposed to either 0 or 500 rad. BrdU-labeled cells in G1 are shown in the box in bold. The average percentage (± standard deviation) of G1 cells labeled with BrdU is at the top of the histograph. (C) Graph depicting the G1/S (open bar) and G2/M (closed bar) checkpoints. For the G1/S checkpoint, the fraction of irradiated BrdU-labeled cells is divided by the fraction of unirradiated BrdU-labeled cells. For the G2/M checkpoint, the fraction of irradiated BrdU-labeled cells in G1 is divided by the fraction of unirradiated BrdU-labeled cells in G1. The averages of clones are shown for control (n = 2), p53−/− (n = 5), ku80−/− (n = 5), and p53−/− ku80−/− (n = 2) cells.

