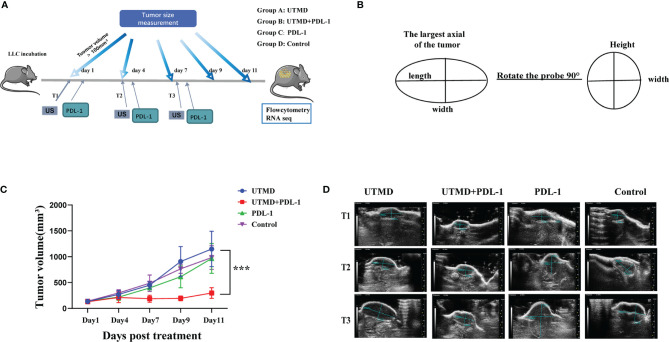
Figure 4.
Tumor progression inhibited by the combination of ultrasound-targeted microbubble destruction (UTMD) and PDL-1 blockade therapy. (A) The timeline of treatments and tumor measurements with different group settings. Groups A and B received the UTMD treatment. Groups B and C received PDL-1 blockade therapy. (B) The illustration of tumor volume measurement with two-dimensional ultrasound. (C) The curve line of tumor growth in a different group setting (n = 5). (D) The representative two-dimensional ultrasound images of tumor size in each group by the time of the first (T1), second (T2), and third (T3) treatments. ***P < 0.001.

