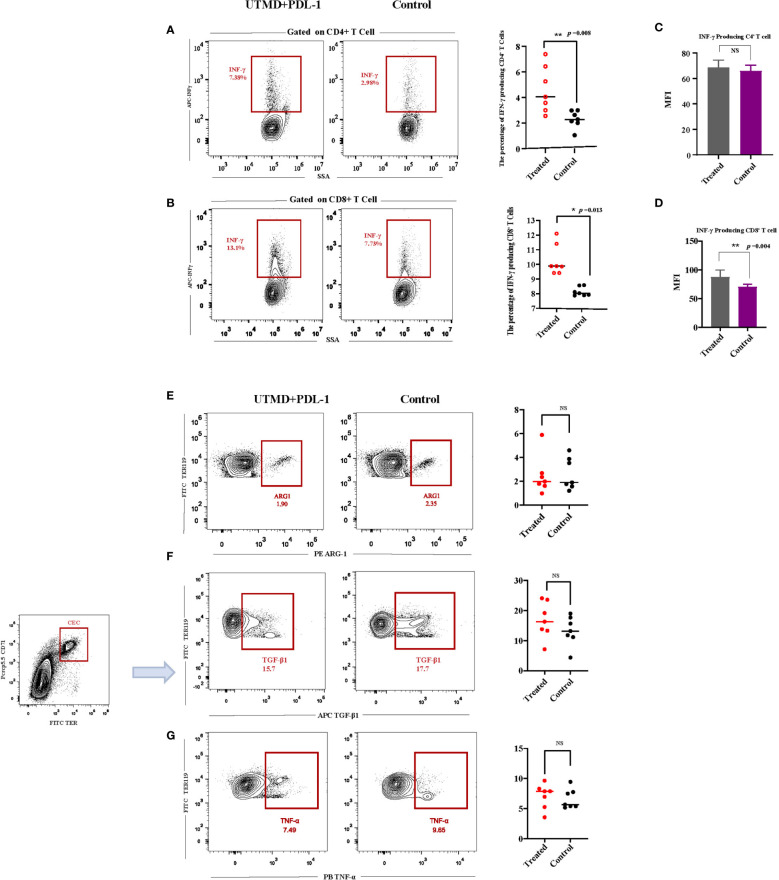
Figure 5.
Interferon-γ (IFN-γ) and CD71+ erythroid progenitor cell (CEC) secreted cytokine productions after ultrasound-targeted microbubble destruction (UTMD) and PDL-1 combination therapy. (A, B) Representative flow cytometry contour plot and cumulative composite data of the frequencies of IFN-γ-producing CD4+ and CD8+ T cells. (C, D) Mean fluorescence intensity (MFI) of CD4+ and CD8+ T cells producing IFN-γ. (E–G) Representative flow cytometry contour plot of the relative fractions of arginase-1-, TNF-α-, and TGF-β-producing CECs, analyzed by intracellular cytokine staining. Each point represents data from an individual mouse (n = 7). *P < 0.05, **P < 0.01, NS, no significance.

