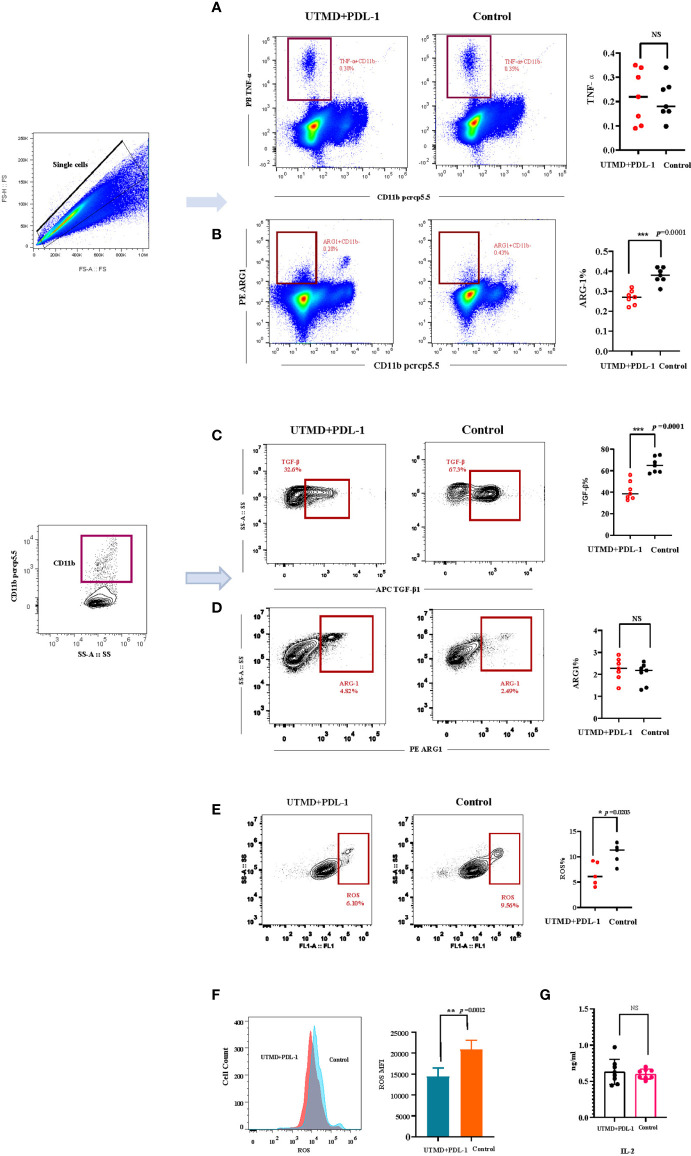
Figure 6.
The relative fractions of arginase-1- and TGF-β-producing CD11b-negative and CD11b-positive cells. (A, B) Representative flow cytometry contour plot and cumulative composite data of the frequencies of TGF-β- and arginase-1-producing CD11b+ cells (n = 7). (C, D) Representative flow cytometry dot plots and cumulative composite data of the frequencies of TNF-α- and arginase-1-producing CD11b− cells (n = 7). (E) Representative flow cytometry contour plot and cumulative composite data of the reactive oxygen species (ROS)-producing cells (n = 5). (F) Representative flow cytometry histogram of ROS and the cumulative composite data of mean fluorescence intensity (MFI). (G) The serum IL-2 (n = 8) was detected by ELISA. Each point represents data from an individual mouse. *P < 0.05, **P < 0.01, ***P < 0.001, NS, no significance.

