
Fig. 6.
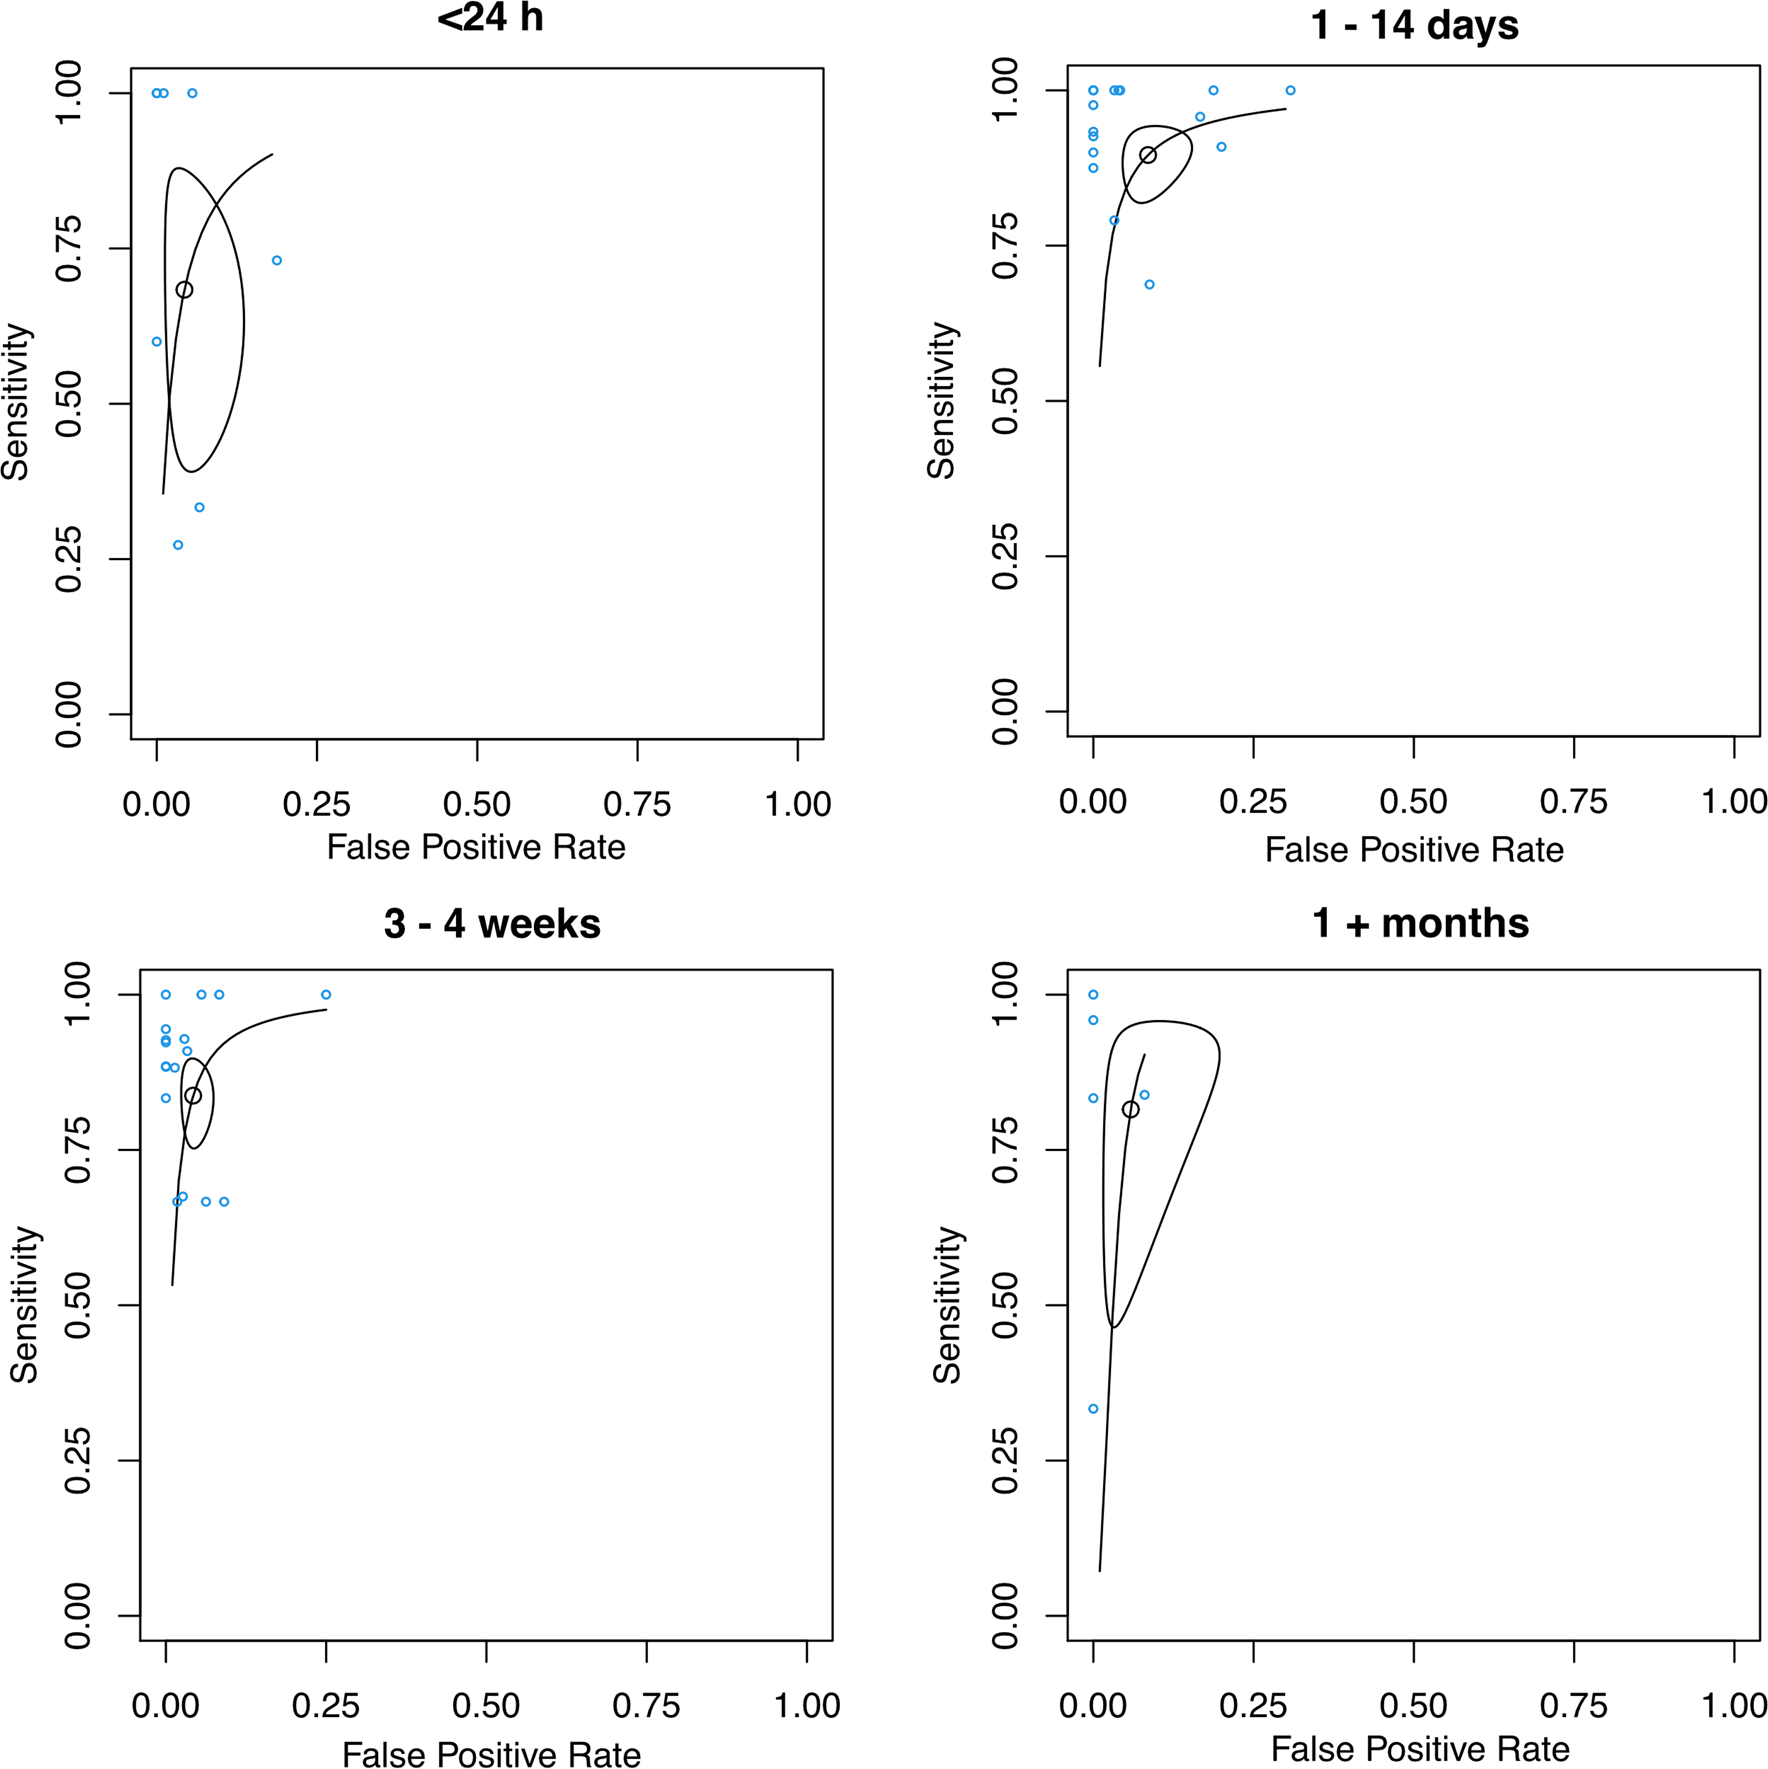
SROC curves of studies analyzed in Fig. 5. The points represent sensitivity and specificity of each individual cohort. The SROC curve in each subfigure summarizes the performance for each group of study. The size of the regions is correlated with imprecision of the summary estimates sensitivity and specificity. The shape of the regions is correlated with heterogeneity in the sensitivity/specificity parameters