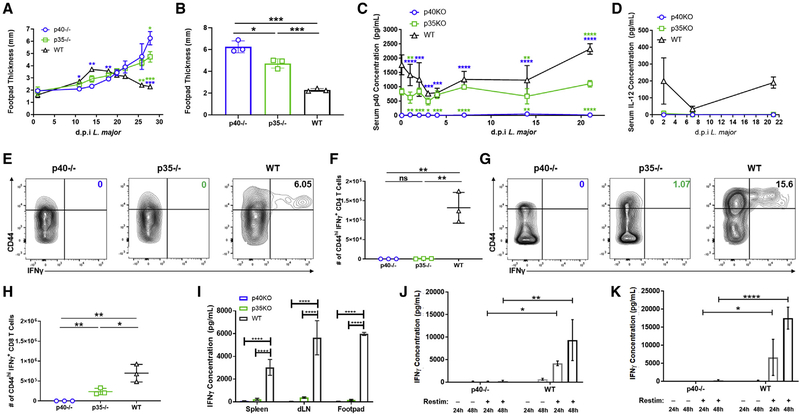
Figure 1. T cell differentiation is disrupted in p40−/− and p35−/− mice.
(A–H) p40−/− (open circles, blue), p35−/− (open squares, green), and WT (open triangles, black) mice were challenged with 106 dsRed L. major parasites by intradermal injection in the footpad.
(A) Biweekly measurement of footpad thickness following appearance of lesions for p40−/− (open circles, blue), p35−/− (open squares, green), and WT (open triangles, black) through the duration of dsRed L. major infection (n = 3).
(B) Footpad thickness of p40−/− (open circles, blue), p35−/− (open squares, green), and WT (open triangles, black) mice 28 days after dsRed L. major infection (unpaired t test, n = 3).
(C and D) Infected animals were bled 4 h and at days 1, 2, 3, 4, 7, 14, and 21 after L. major infection. Serum (C) p40 and (D) IL-12 levels for p40−/− (open circles, blue), p35−/− (open squares, green), and WT (open triangles, black) animals were measured by ELISA (n = 3).
(E–H) Splenocytes harvested 28 days after L. major infection were restimulated and analyzed via flow cytometry. Gating strategy used in these panels is shown in Figure S1A.
(E) Percentage of IFNγ-producing CD4+ T cells within the CD44hi subset in the spleen measured 28 days after dsRed L. major infection (n = 3).
(F) Number of CD44hiIFNγ+CD4+ T cells in the spleen of p40−/− (open circles, blue), p35−/− (open squares, green), and WT (open triangles, black) animals measured 28 days after dsRed L. major infection (unpaired t test, n = 3).
(G) Similar to (D), except CD8+ T cells (n = 3).
(H) Similar to (E), except CD8+ T cells (unpaired t test, n = 3).
(I) Cells from the spleen, draining popliteal lymph nodes (dLNs), and footpad were harvested 28 days after dsRed L. major infection and restimulated with soluble Leishmania antigen (SLA). Concentration of IFNγ in supernatant was measured by ELISA collected from p40−/− (blue), p35−/− (green), and WT (black, shaded) after restimulation for 48 h (unpaired t test, n = 3).
(J and K) SMARTA T cells from CD45.1+ donor animals were sorted and transferred into CD45.2+ p40−/− or CD45.1+CD45.2+ WT recipient animals and challenged 24 h later with GP61–80 and LPS. 4 days after challenge, harvested cells from the spleen and LNs were restimulated with GP61–80 in vitro for 24 or 48 h. Concentrations of IFNγ in the supernatant of (J) splenocyte or (K) LN SMARTA T cells transferred into p40−/− (open bars, blue gradient) or WT (open bars, gray gradient) animals 24 or 48 h after restimulation (n = 3) are shown.
Data in this figure are representative of two independent experiments where n refers to the number of biological replicates in each experiment. (A)–(D), (F), and (H)–(K) are displayed as mean ± SEM. *p < 0.05, **p < 0.01, ***p < 0.001, ****p < 0.0001. Colored asterisks indicate relative significance to different groups (blue is significance to p40−/− and green is significance to p35−/−). Anything unmarked is considered not significant.

