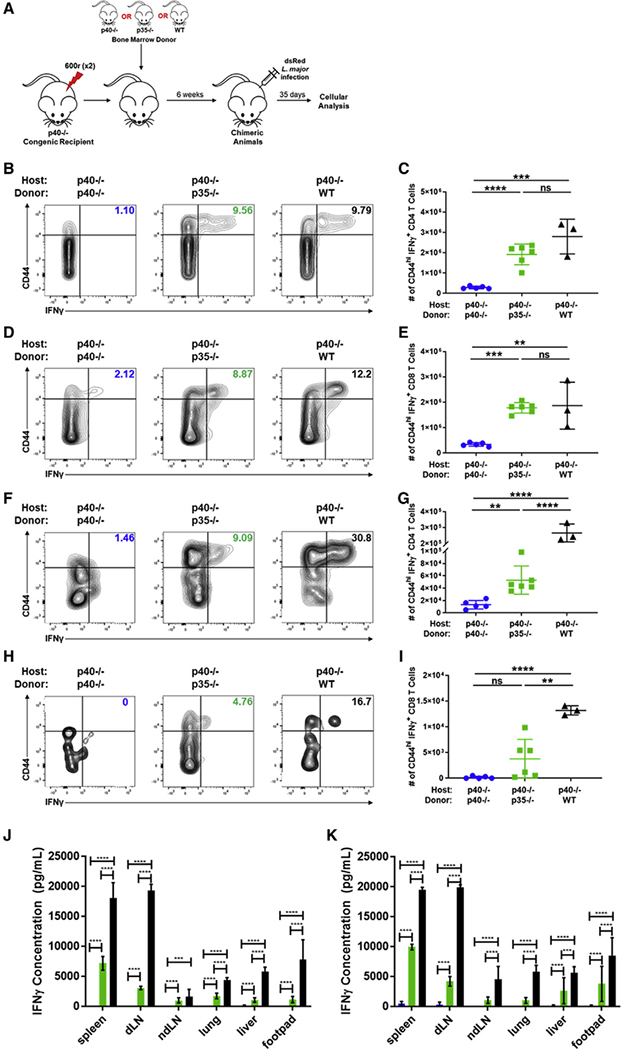
Figure 4. Two-cell formation of IL-12 triggers downstream IFNγ in response to L. major infection.
(A) Schematic of experimental design. Bone marrow chimeras were generated by reconstituting irradiated CD45.1+ p40−/− with bone marrow cells from CD45.2+ p40−/−, CD45.2+ p35−/−, or CD45.1+CD45.2+ WT donor mice. Chimeric mice were infected in the footpad dermis with 106 dsRed L. major parasites following reconstitution. 35 days after infection, tissues were harvested and restimulated for intracellular cytokine staining and flow cytometric analysis. Gating strategy used for these panels is shown in Figure S3A.
(B) Percentage and of CD44hiIFNγ+CD4+ T cells in the spleen of p40−/− host chimeras measured 35 days after infection (p40−/−→p40−/−, n = 4; p35−/−→p40−/−, n = 6; WT→p40−/−, n = 3).
(C) Number of CD44hiIFNγ+CD4+ T cells in the spleen of p40−/− host chimeras reconstituted with p40−/− (circles, blue), p35−/− (squares, green), or WT (triangles, black) donor bone marrow 35 days after infection (unpaired t test, p40−/−→p40−/−, n = 4; p35−/−→p40−/−, n = 6; WT→p40−/−, n = 3).
(D) Same as in (B), except CD8+ T cells (p40−/−→p40−/−, n = 4; p35−/−→p40−/−, n = 6; WT→p40−/−, n = 3).
(E) Same as in (C), except CD8+ T cells (unpaired t test, p40−/−→p40−/−, n = 4; p35−/−→p40−/−, n = 6; WT→p40−/−, n = 3).
(F) Percentage of CD44hiIFNγ+CD4+ T cells in lymphocytes harvested from the footpad lesion tissue of p40−/− host chimeras 35 days after infection (p40−/−→p40−/−, n = 4; p35−/−→p40−/−, n = 6; WT→p40−/−, n = 3).
(G) Number of CD44hiIFNγ+CD4+ T cells in lymphocytes harvested from the footpad lesion of p40−/− host chimeras reconstituted with p40−/− (circles, blue), p35−/− (squares, green), or WT (triangles, black) donor bone marrow 35 days after infection (unpaired t test, p40−/−→p40−/−, n = 4; p35−/−→p40−/−,n= 6; WT→p40−/−, n = 3).
(H) Same as in (F), except CD8+ T cells (p40−/−→p40−/−, n = 4; p35−/−→p40−/−, n = 6; WT→p40−/−, n = 3).
(I) Same as in (G), except CD8+ T cells (unpaired t test, p40−/−→p40−/−, n = 4; p35−/−→p40−/−, n = 6; WT→p40−/−, n = 3).
(J and K) Cells from each tissue were harvested 35 days after infection and restimulated with soluble Leishmania antigen (SLA). Concentrations are shown of IFNγ in supernatant by tissues collected from p40−/−→p40−/− (blue), p35−/−→p40−/− (green), and WT→p40−/− (black) after restimulation for (J) 24 and (K) 48h (unpaired t test, p40−/−→p40−/−, n = 4; p35−/−→p40−/−, n = 6; WT→p40−/−, n = 3).
Data in this figure are representative of two independent experiments where n refers to the number of biological replicates. (C), (E), (G), and (I)–(K) are displayed as mean ± SEM. *p < 0.05, **p < 0.01, ***p < 0.001, ****p < 0.0001. Anything not marked is considered not statistically significant.

