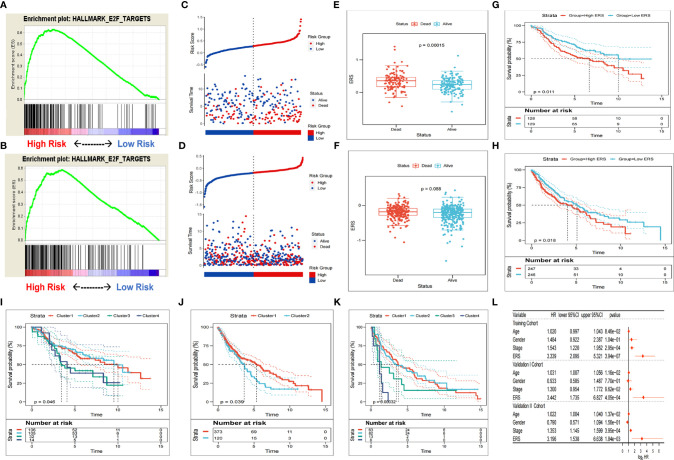
Figure 4.
Verification of gene signatures in different sets. (A, B) GSEA validated E2F pathway enrichment in the validation I and II sets. (C, D) The dead patients in the validation I and II sets showed higher ERS. (E, F) The patients of the high-ERS group in the validation I and II sets had worse survival. (G, H) Patients with higher ERS have a poorer prognosis in the validation I and II sets. (I–K) On the basis of the expression patterns of gene signature, the survival rate of clusters derived from consensus clustering differed greatly. (L) Multivariate Cox regression analysis showed ERS as an independent risk factor for OS in the validation I and II sets.

