. 2021 Nov 3;18(6):699–713. doi: 10.21873/cgp.20291

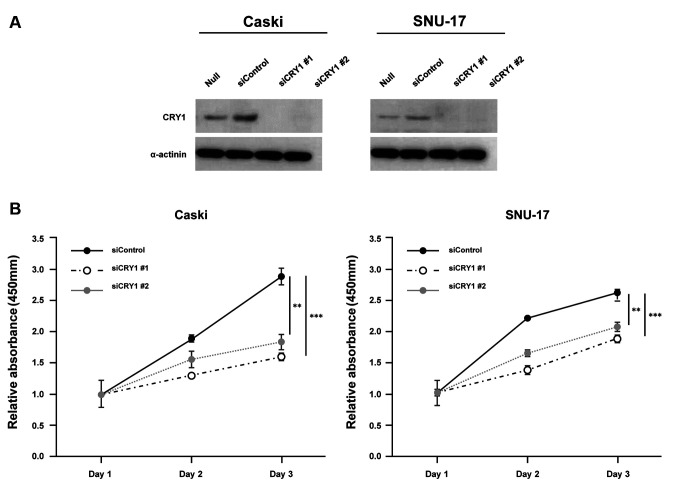
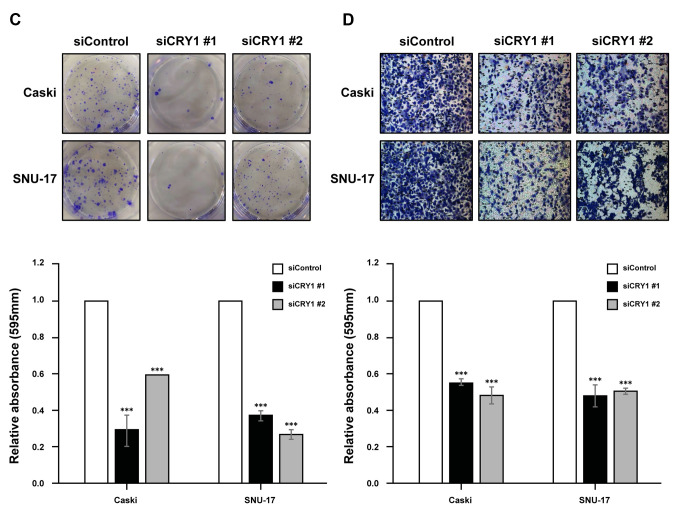
Figure 3. Effect of CRY1 in cervical cancer cell lines. CRY1 was knocked down in Caski and SNU-17 cells for 72 h. (A) Protein expression of CRY1 and α-actinin was analysed by western blot. (B) The proliferation of siControl- and siCRY1- transfected Caski and SNU-17 cells was detected using EZ-Cytox assay, at indicated time points. (C) Colony formation was performed with siControl and siCRY1 transfected cell. Upper panel: representative image of colonogenic assay. Lower panel: quantitative results of colonogenic assay. (D) Cell invasion assay was conducted using the Boyden chamber assay. Upper panel: representative image of Boyden chamber assay. Lower panel: quantitative result of Boyden chamber assay. The number of asterisks (*) indicates the level of significance: **p<0.05, ***p<0.005. Error bars represent the mean±standard error (S.E) of triplicate experiments.

Figure 3

Figure 3