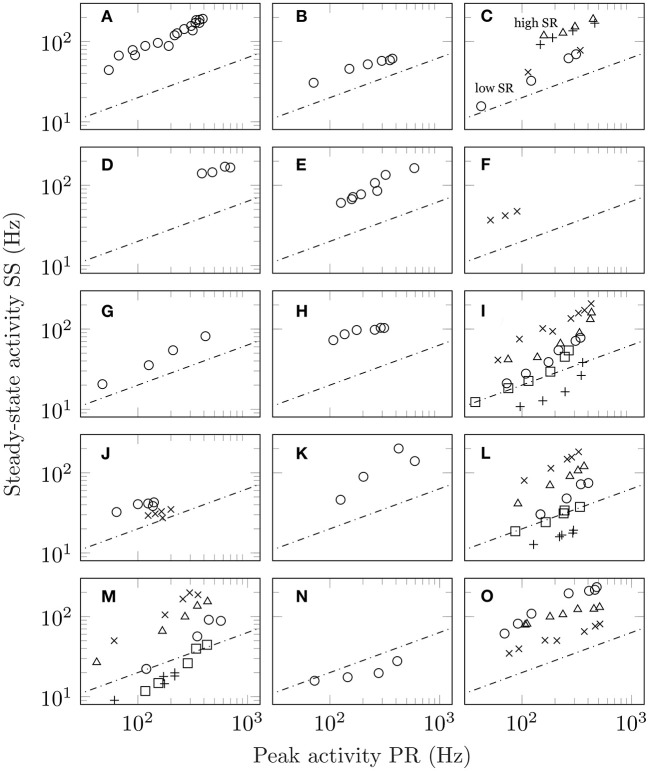
Figure 2.
Steady-state activity (SS) plotted as a function of peak activity (PR) for different stimulus intensities. In all panels, the dashed line shows the predictions of Equation (1) which is a line with slope one-half on a log-log plot with the value of SR set arbitrarily equal to 4. The actual value of intercept depends on the precise value of the unit's spontaneous activity. (A) Plot of SS vs PR for auditory data taken from a single guinea pig fibre (figure 1, unit GP-17-4), Smith and Zwislocki (1975); (B) the same for auditory data from a single gerbil fibre (figure 1, unit E8F2), Westerman and Smith (1984); (C) results for four separate guinea pig auditory fibres of both high and low spontaneous activity (triangles, figure 1, unit GP31/08; plusses, figure 2, unit GP27/18; circles, figure 1, GP31/13; crosses, figure 2, GP27/04), Yates et al. (1985); (D) the averaged auditory data from ferrets (figure 6), Sumner and Palmer (2012); (E) auditory responses obtained from the saccular nerve fibres of a gold fish (figure 3, increment), Fay (1985); (F) responses from lateral line in fish (figure 6), Mogdans et al. (2017) (G) stretch response in crayfish (figures 1 and 2, both PR and SS are shifted upwards by 0.5 log units), Brown and Stein (1966); (H) stretch response in frog (figure 3, both PR and SS are shifted upwards by 1 log unit), Loewenstein (1956); (I) response of olfactory receptor neurons in fruit flies (figure 3a: crosses, shifted +0.3 log units; figure 5: triangles, shifted +0.1 log units, methyl butyrate; circles, shifted −0.1 log units, methyl butyrate; squares, shifted −0.3 log units, 1-pentanol; plusses, shifted −0.5 log units, propyl acetate), Martelli et al. (2013); (J) taste recordings in fruit fly sensilla (circles, figure 3; crosses, figure 7), Gothilf et al. (1971); (K) taste response in caterpillar (figure 3), Bernays et al. (2002); (L) taste response in blowfly (figure 2a: circles, LiCl, shifted +0.2 log units; triangles, NaCl; crosses, KCl, shifted −0.2 log units; squares, RbCl, shifted −0.4 log units; plusses, CsCl, shifted −0.6 log units), Maes and Harms (1986); (M) same as (L) but for figure 2b, Maes and Harms (1986); (N) response to cooling in beetles (figure 10), Merivee et al. (2003); and (O) vision data from a single ON-centre ganglion cell in the cat. The vision data differ from the other auditory data in that they are derived from pre-adapted luminance values (figure 7: circles, 1 × 10⁻⁵ cd m−2, shifted +0.2 log units; plusses, 1 × 10⁻³ cd m−2; crosses: 1 × 10⁻¹ cd m−2, shifted −0.2 log units), Sakmann and Creutzfeldt (1969).

