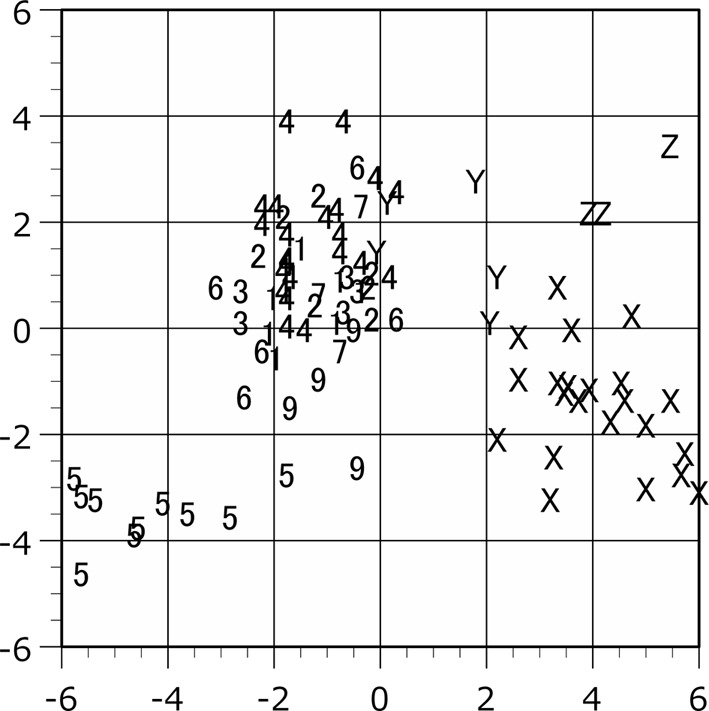
Fig. 4.

Scattergram of the plots in the canonical discriminant analysis. The raw measurement values of male are applied to the analysis. The individual scores are shown on the discriminant axes 1 (horizontal) and 2 (vertical). Plot symbols indicate the locality of the specimen as shown in Table 1.
