
Figure 10.
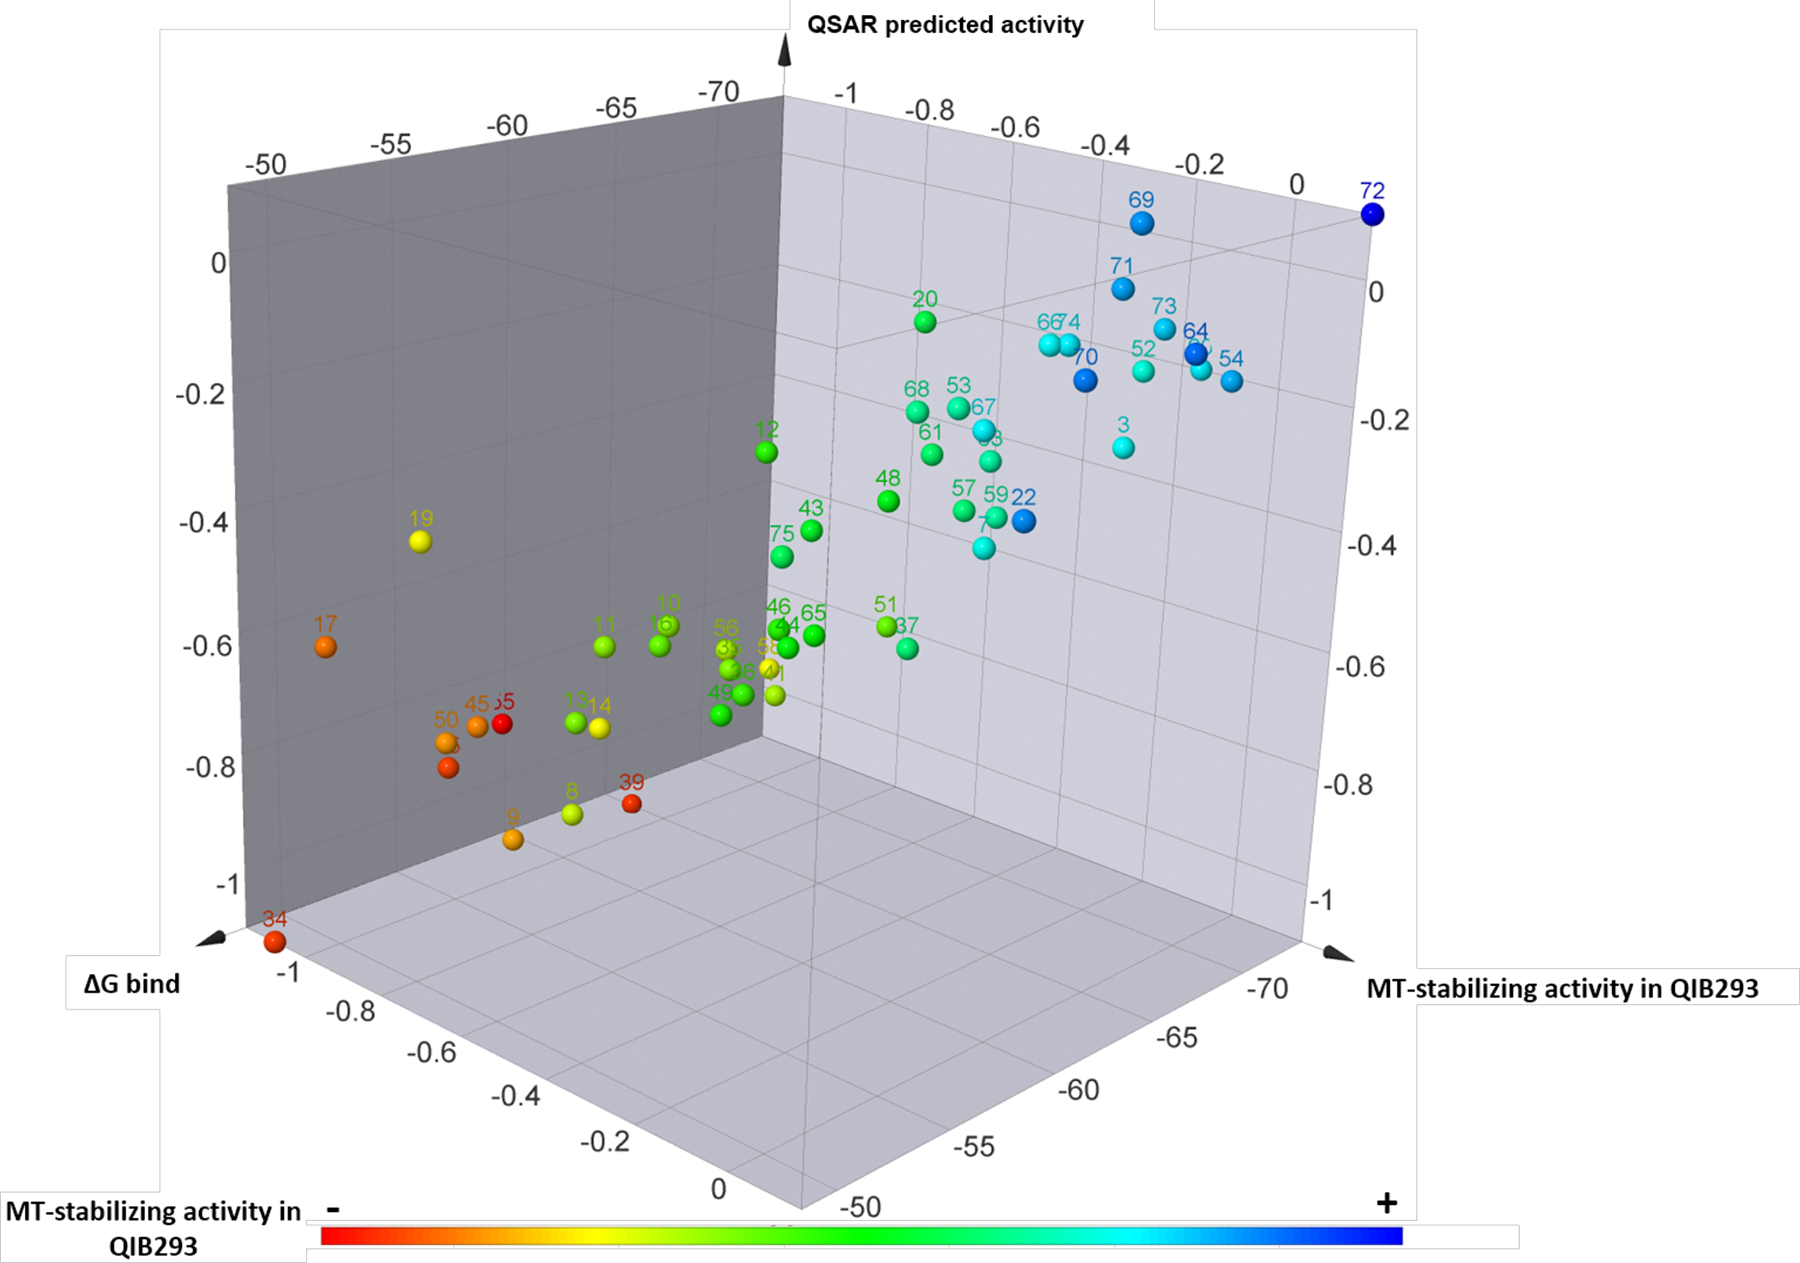
3D summary plot of Class I triazolopyrimidines showing the experimental MT-stabilizing activity in the QBI293 assay, the MMGBSA score value (ΔG bind), and the QSAR predicted activity. The experimental MT-stabilizing activity of test compounds is plotted both via color coding and as the log of the average of the activity at 1 and 10 μM in the AcTub assay, relative to positive control, , see Experimental for further details.