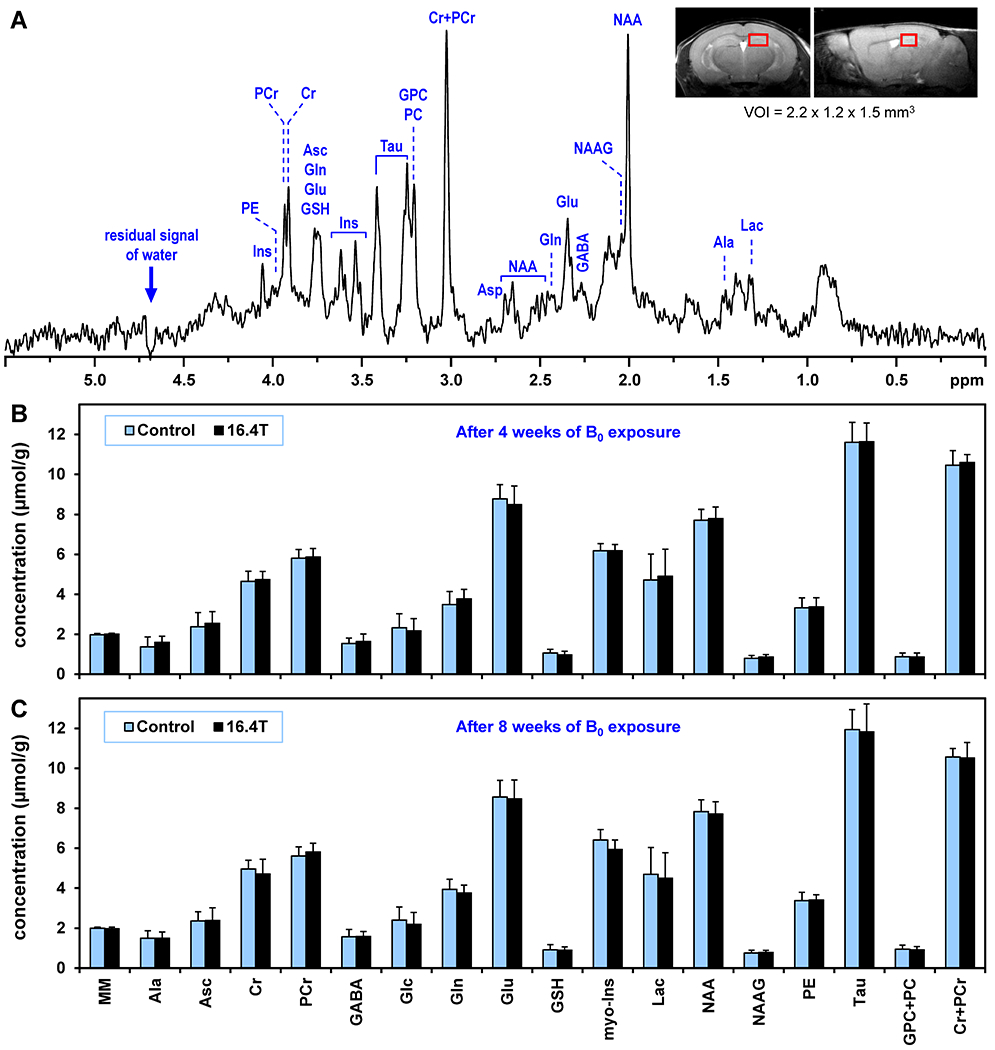
Figure 2.

(A) A representative in vivo 1H MR spectrum acquired from the hippocampus of C57BL/6 mouse exposed to 16.4 T. STEAM, TE = 2 ms, TR = 5 s, number of averages = 320, VOI = 3.8 μL. Inset: fast-SE axial and sagittal images show the typical position of VOI centered in dorsal hippocampus. (B, C) Comparison of hippocampal neurochemical profiles of C57BL/6 mice chronically exposed to 16.4 T relative to control mice (N = 12 per group). (B) 4-week long exposure, (C) 8-week long exposure. Error bars indicate SD. Significant differences between groups were not detected for any metabolite (t-test). Used abbreviations: macromolecule (MM), alanine (Ala), ascorbate (Asc), creatine (Cr), phosphocreatine (PCr), γ-aminobutyric acid (GABA), glucose (Glc), glutamine (Gln), glutamate (Glu), glutathione (GSH), myo-inositol (Ins), lactate (Lac), N-acetylaspartate (NAA), N-acetylaspartylglutamate (NAAG), phosphoethanolamine (PE), taurine (Tau), glycero-phosphocholine (GPC), phosphocholine (PC).
