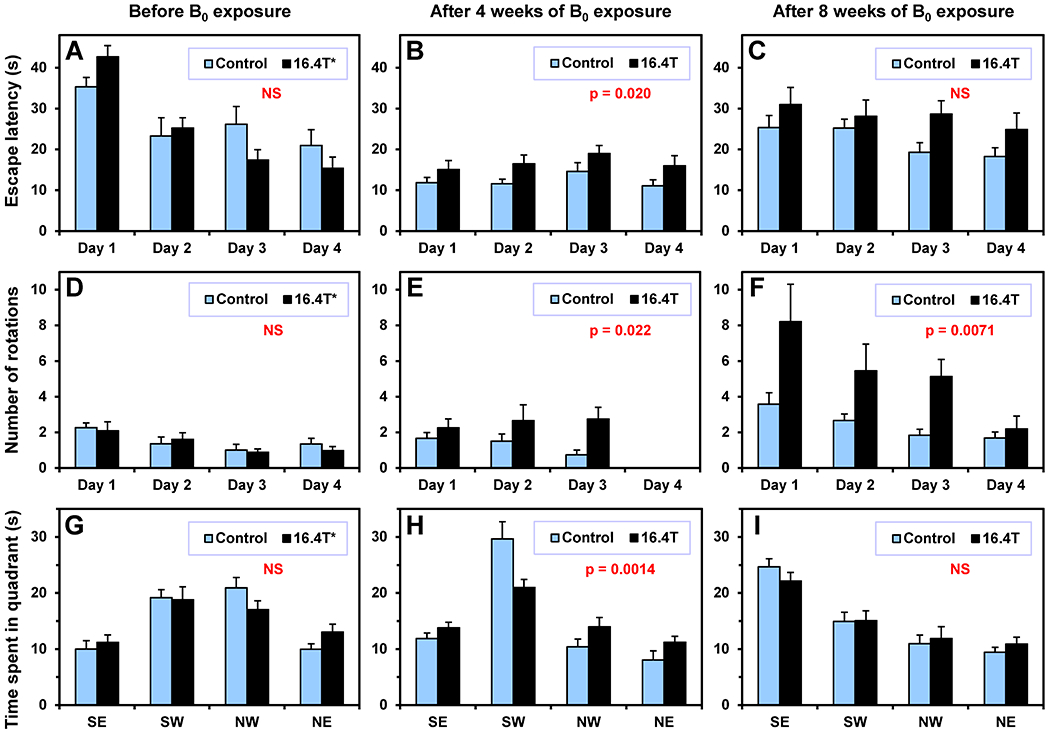
Figure 3.

Morris water maze (MWM) test – Protocol I. Comparison of mice chronically exposed to 16.4 T (N = 12) relative to controls (sham exposure, N = 12). Animals were tested in three MWM sessions: (A, D, G) before the B0 exposure, (B, E, H) after 4 weeks of the B0 exposure and (C, F, I) after 8 weeks of the B0 exposure. (A-C). Escape latency, (D-F) angular velocity analysis – number of tight-circling 360° rotations, (G-I) the probe test – time spent in four quadrants. Probe target zones: (G) NW – before exposure, (H) SW – after 4 weeks of exposure, (I) SE – after 8 weeks of exposure. Four trials for each animal were performed every day (Day 1 – 4), only one trial per animal was performed during the probe test. Two-way ANOVA: p-values for B0 exposure factor (A-F), multiple comparison p-values for the target zones (G – NW, H – SW, I – SE). Error bars indicate SEM. (E) Data for Day 4 are missing due to malfunction of the video recording.
