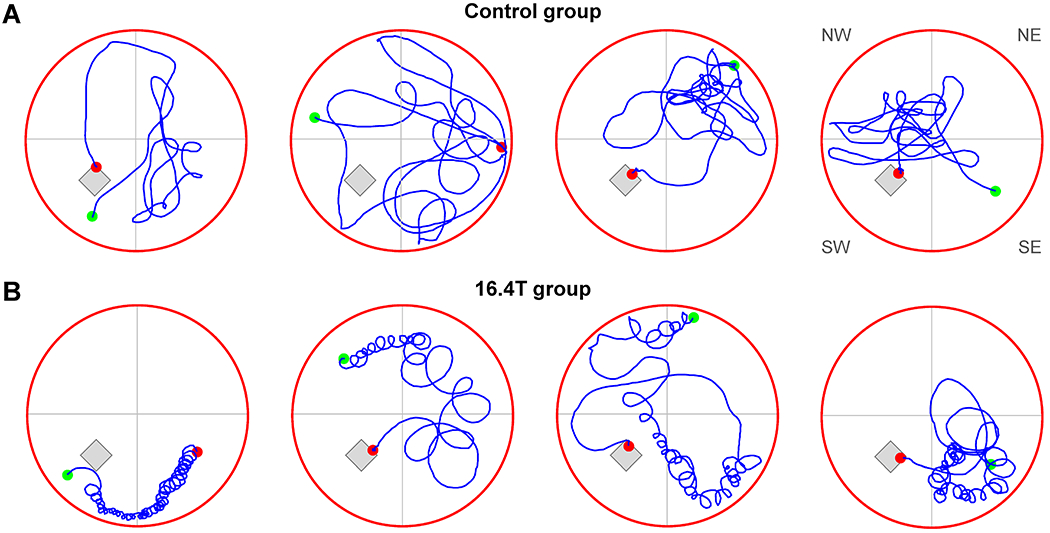
Figure 4.

Morris water maze test – Protocol I. Characteristic swimming trajectories of four control mice (A) and four mice exposed to 16.4 T for 8 weeks (B). Maximum duration of the test = 60 s. The hidden platform and virtual division of the pool into quadrants are depicted. Green dots: start points, red dots: end points. The MWM test started in quadrants (from left to right): SW. NW, NE and SE.
