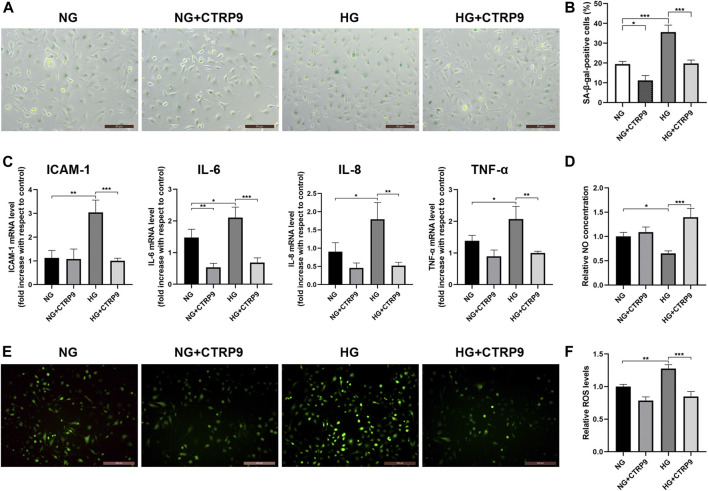
FIGURE 3.
CTRP9 alleviates HG-induced senescence, SASP, and HUVEC dysfunction. (A) Cells were fixed and stained for SA-β-gal activity. The images are taken by ×10magnification. (B) Histogram represents the quantitative analysis of SA-β-gal-positive cells per microscopic field. (C) Cell lysates were used to detect several key SASP component cytokine mRNA levels by qRT-PCR. Results were normalized to controls, and histograms represent the relative intensity of IACM-1, IL-6, IL-8, and TNF-α levels. (D) Total NO production in the culture medium was determined by the modified Griess reaction method, and the histogram represents the relative intensity of NO. (E) Cells were fixed and stained with dihydroethidium to detect intracellular ROS levels. The images were taken at ×100magnification. (F) The histogram represents the relative intensity of fluorescence signal per microscopic field. Values represent mean ± SEM (n = 3–4 per group). *p < 0.05, **p < 0.01, ***p < 0.001.

