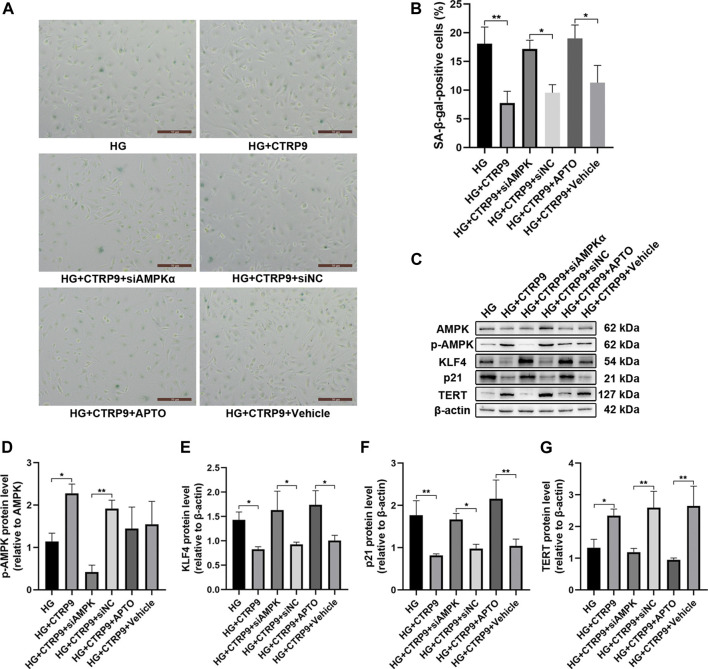
FIGURE 5.
CTRP9-mediated anti-senescence effect is mediated via the AMPKα/KLF4 pathway. (A) Cells were fixed and stained for SA-β-gal activity. The images were taken at ×10magnification. (B) The histogram represents the quantitative analysis of SA-β-gal-positive cells per microscopic field. Values represent mean ± SEM. *p < 0.05, **p < 0.01. (C) AMPK, p-AMPK, KLF4, p21 and TERT protein levels were determined by immunoblotting. (D-G) Results were normalized to controls, and histograms represent the relative intensities of p-AMPK, KLF4, p21, and TERT. Values represent mean ± SEM (n = 3–4 per group). *p < 0.05, **p < 0.01.

